Case Study
What is Edamame?
Edamame is an open-source, distributed load testing framework, optimized for real-time collaboration apps that use both HTTP and WebSockets. It comes with a CLI and a React UI that enables developers to easily self-host cloud-based architecture on AWS. Edamame supports tests of up to 200k virtual users, visualizes data in near real-time, and includes a stop functionality allowing developers to end their tests early.
Creating a load tester with these features comes with a unique set of challenges:
- Coordinating distributed tests: The scale of Edamame load tests necessitated expanding into a distributed architecture while ensuring that the load tests remained synchronized.
- Processing 1M+ data points/second (in near real time): Large load tests on Edamame can generate 1M+ metrics per second, all of which need to be processed and displayed in near real time.
- Extracting useful insights: When testing applications that use both HTTP and WebSockets, it’s important to extract metrics that provide insights into the application’s performance across both protocols.
In the sections that follow, we’ll explore how Edamame offers an easy-to-use, plug-and-play solution to the above challenges.
Background: Load testing
What is load testing?
What happens when a web application gets more traffic than anticipated? Can the underlying infrastructure handle the traffic? Does the application slow down? Or—worst case scenario—does the application crash?
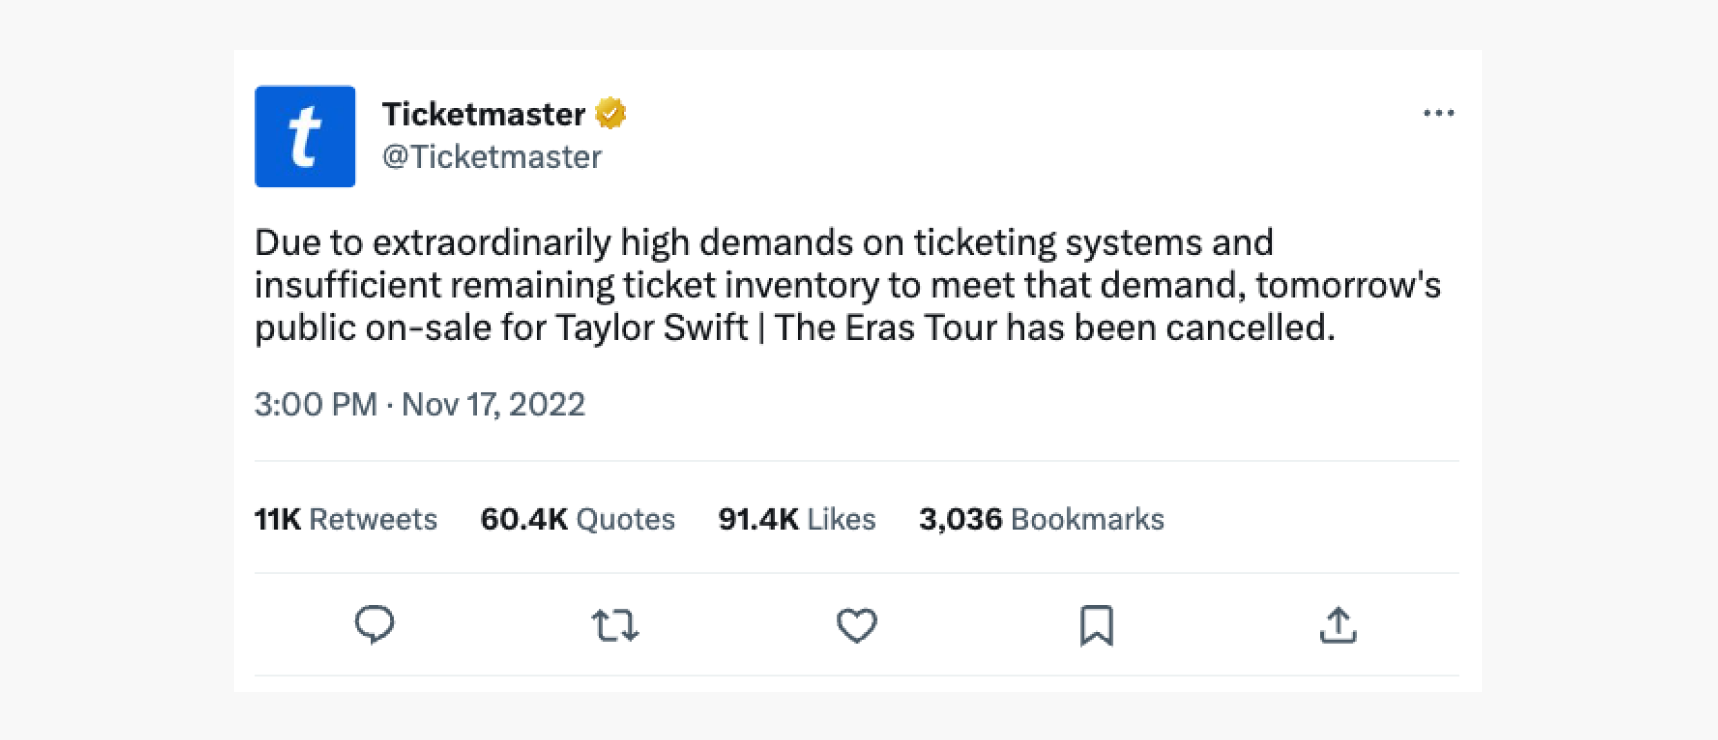
Experiencing slow websites, downtime, or other issues due to excessive traffic is a frustrating reality for many internet users. Whether it's a popular online sales event like Black Friday or a highly anticipated concert, the surge of visitors to a website can cause it to slow down or even crash. Ticketmaster found out just how bad things could get when 14 million users tried to buy Taylor Swift tickets and crashed their site1.
To ensure their application can handle this kind of situation, developers re-create high-traffic scenarios by performing load tests. Load testing is the process of simulating realistic end-user behavior in large volumes and measuring how the target server responds. In a load test, a number of programmatically generated "virtual users" are automated to interact with the target server in predefined patterns. This process helps developers identify performance bottlenecks within a system and ensures that user experience won't be negatively impacted, even under heavy strain.
One way to perform a basic load test is to use an HTTP benchmarking tool, like wg/wrk.2 This involves sending frequent HTTP requests to a target endpoint to simulate large amounts of traffic and monitoring the system’s response.
wrk --connections=400 --duration=30s http://127.0.0.1:8080/index.html
While this is a simple approach to load testing, more complexities arise when a developer tries to comprehensively test a multifaceted application. Depending on the developer's requirements, there can be many considerations involved in building a load tester.
Considerations when building a load tester
Scale
Running load tests locally is limiting. It's difficult to simulate thousands of separate users on a single host. For example, a load testing tool with a fairly low memory footprint used on a 2-core CPU host with 8GB of RAM can generate a maximum of about 6k virtual users.3
There are three main limiting factors to load testing on a local machine:
- CPU: The CPU is heavily utilized in a load test. If it is not powerful enough, it can become a bottleneck, slowing down the test and limiting the number of virtual users that can be simulated.
- Memory: Load tests running on a single host cannot generate more virtual users than the RAM will support. Load tests often use 1 - 20 MB per virtual user, so even with only 1000 VUs, developers might need up to 20GB of RAM to run that load test.4
- Network: If the network throughput is too low, the load test may not accurately simulate the real-world conditions of user traffic, resulting in inaccurate or unreliable test results. For instance, in the example host above the maximum network bandwidth is 10GB.5
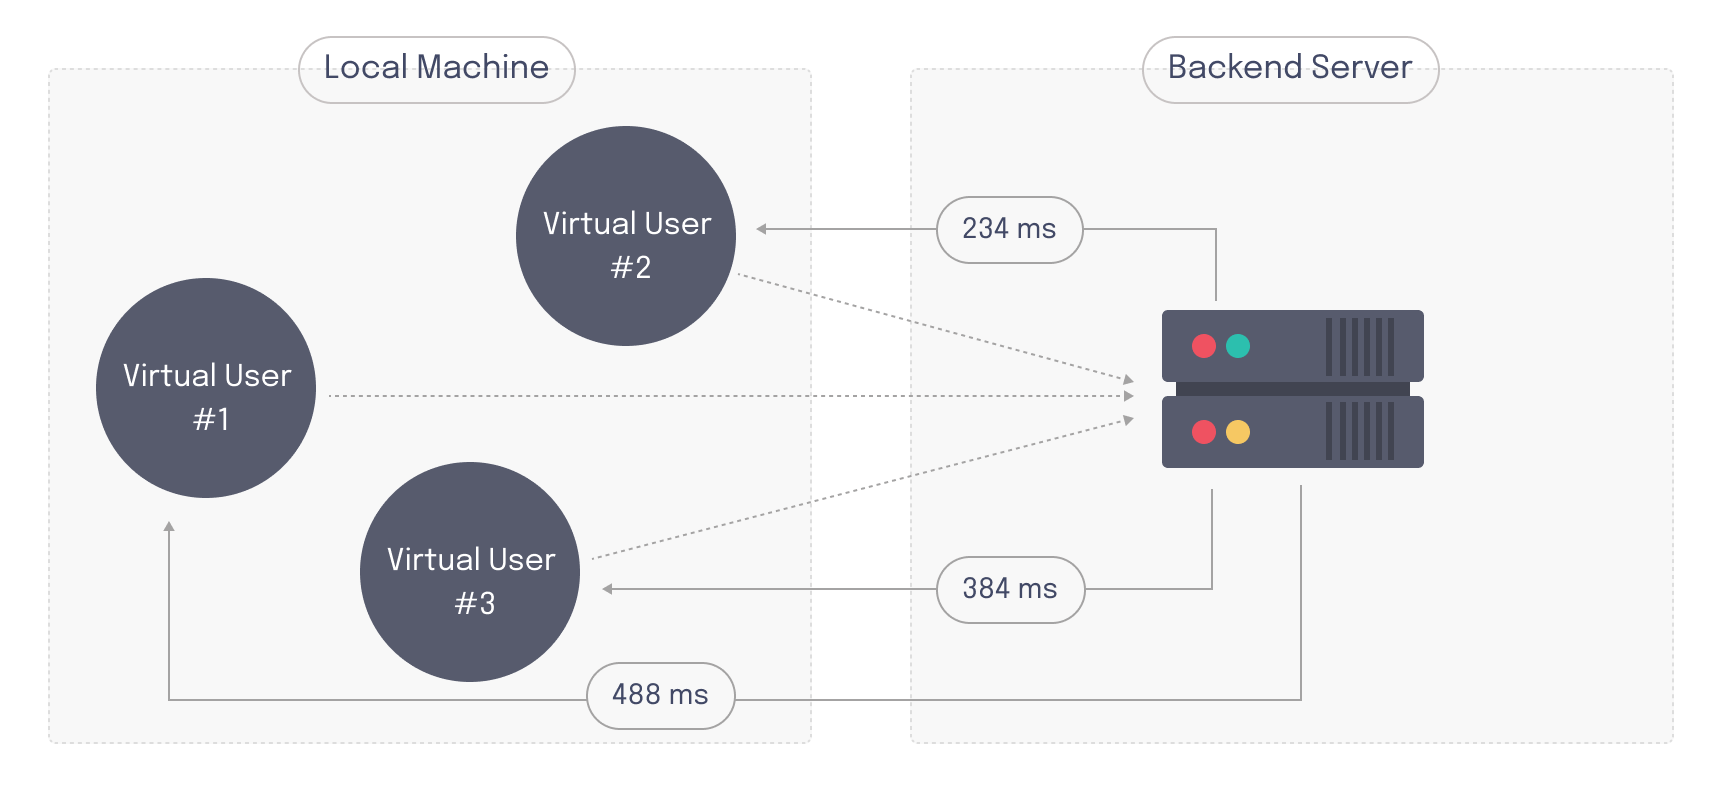
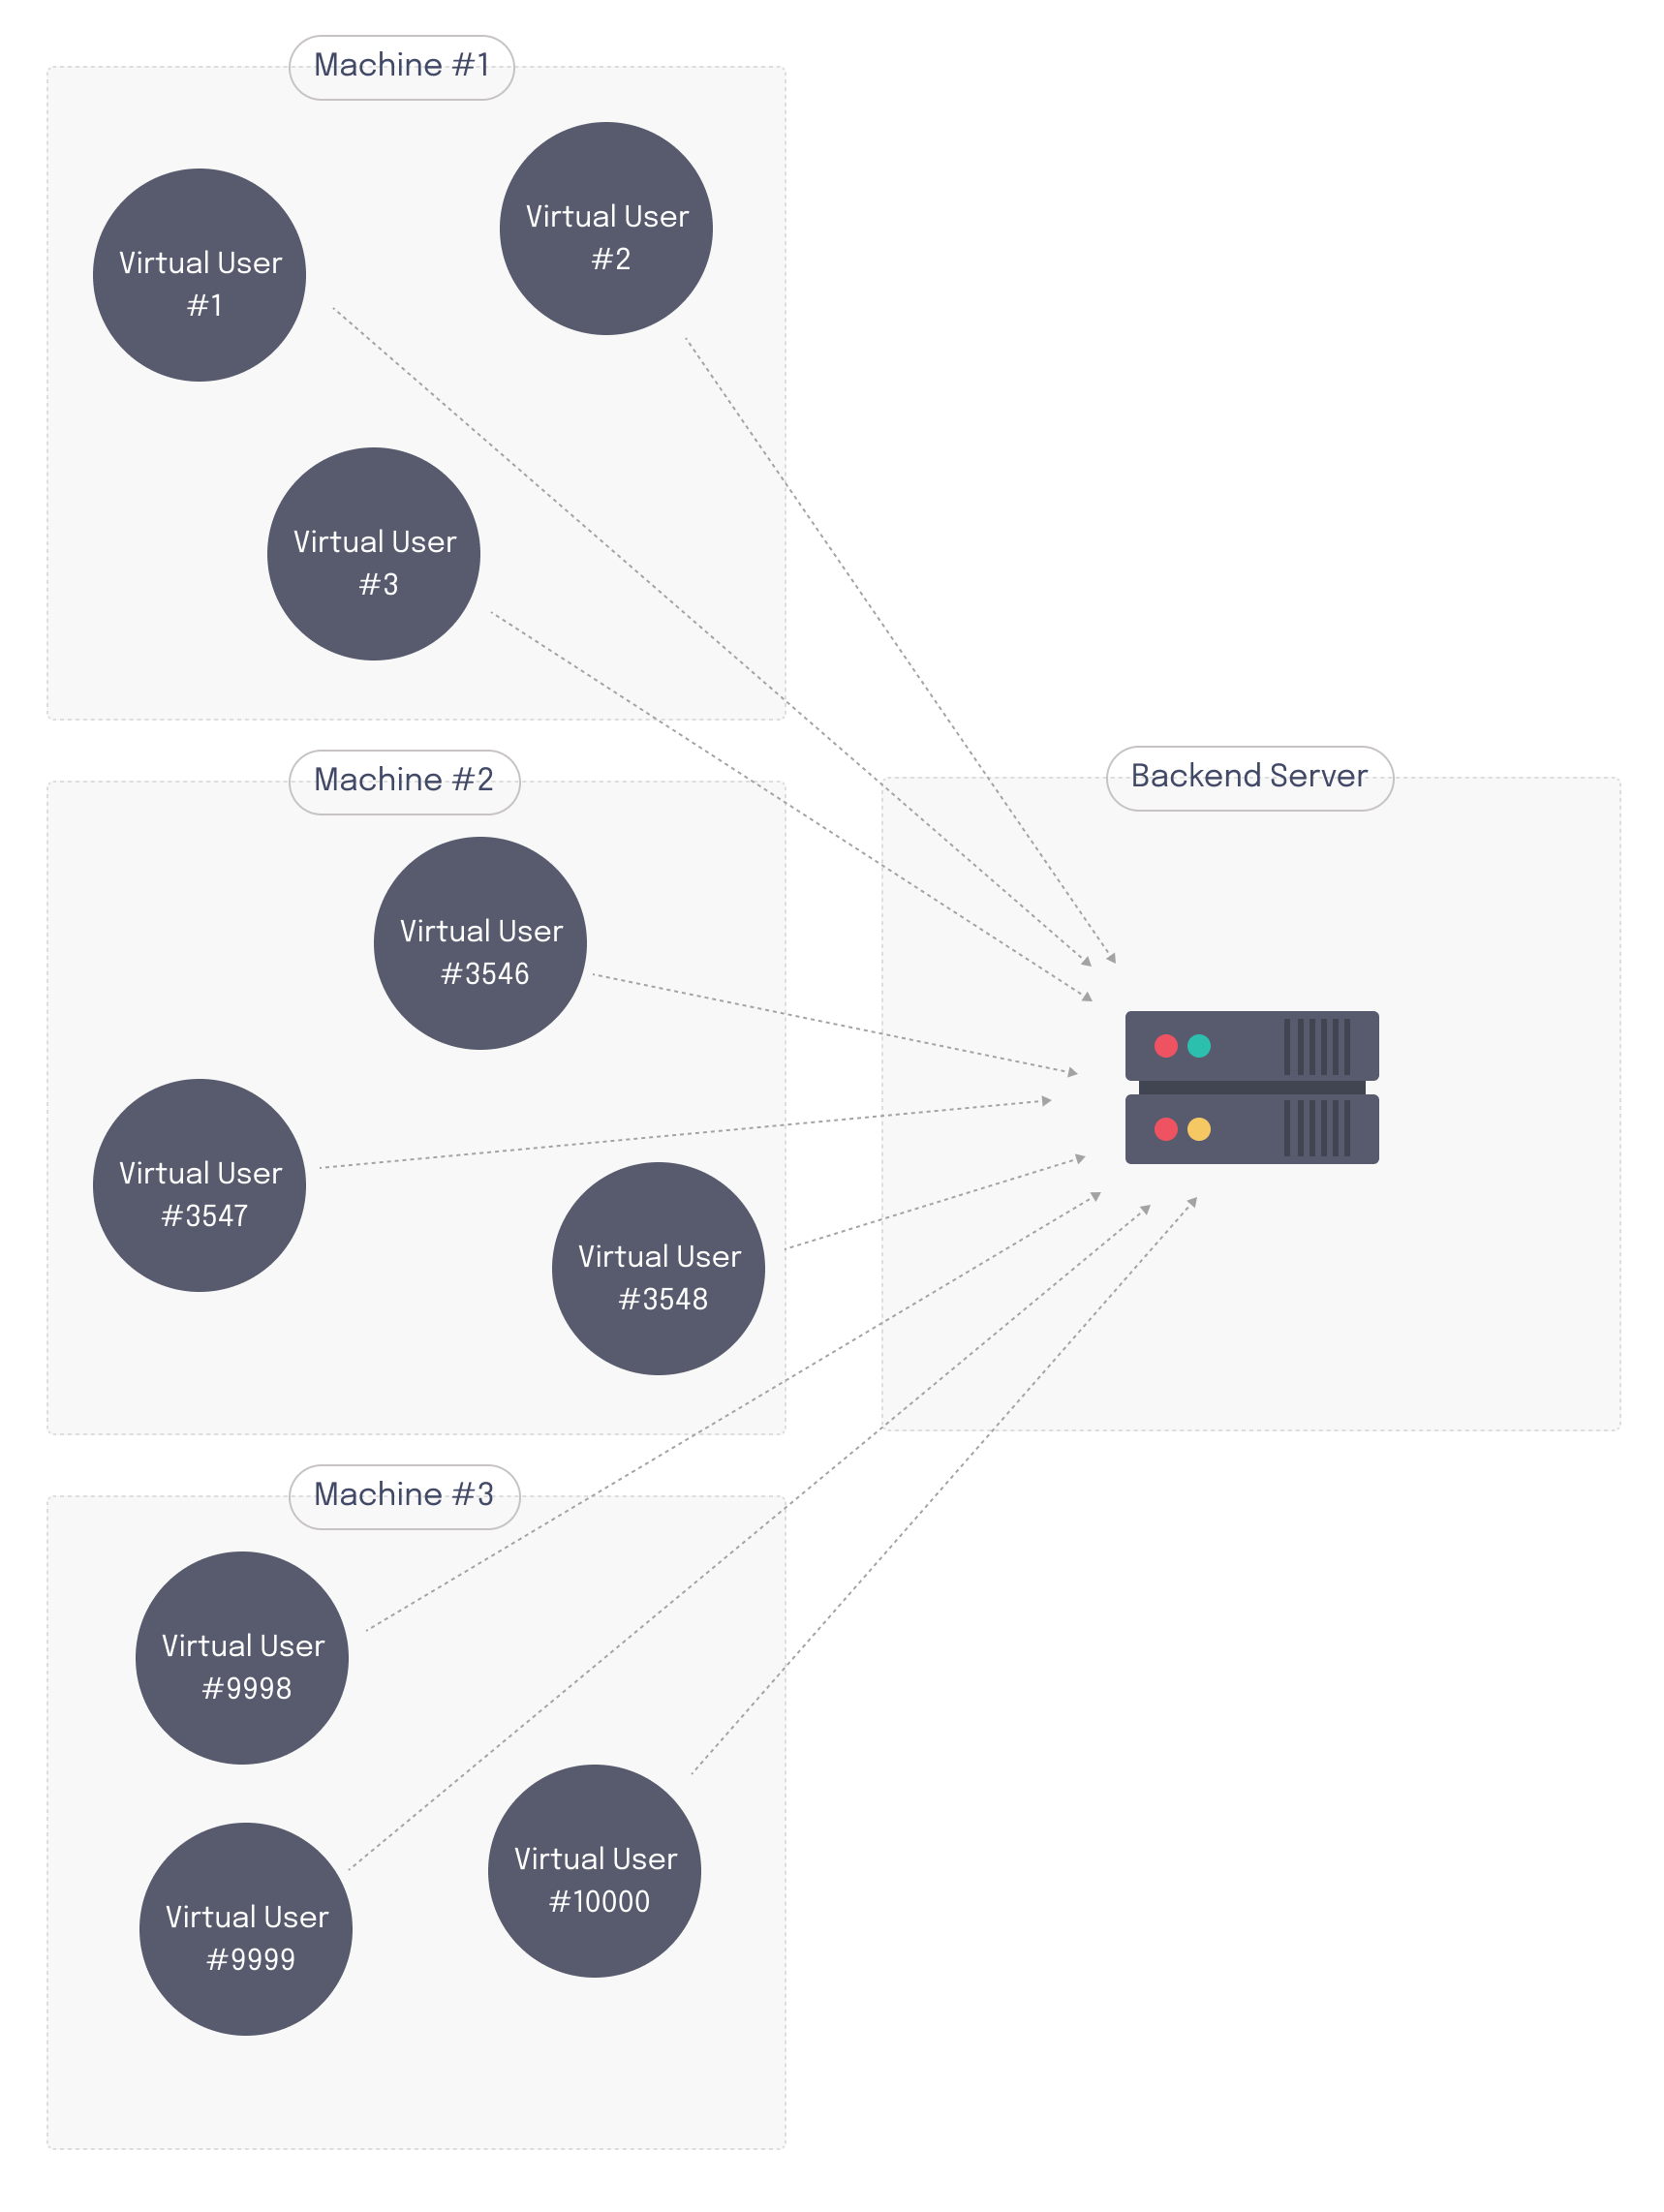
If local resources do not allow a developer to reach the desired number of virtual users, then it's necessary to run a distributed load test. In a distributed load test multiple hosts generate load. The hosts which create virtual users and run the test are often known as "load generator nodes" or "test runner nodes". These can be horizontally scaled to support the number of virtual users required.
Protocol
Protocol refers to the type of traffic being generated to interact with the target server. As HTTP is the main protocol of the web, HTTP is frequently used when load testing web applications. However, there are many other protocols as well, some of which are used to communicate with users and some of which are used to facilitate communication between application components internally.
If developers want to test their entire system comprehensively, they need to ensure load tests simulate all the protocols that underlie their system.
Metrics
Metrics are quantitative measures used to evaluate the performance of the web application. Generally speaking, there are two kinds of metrics that can be used to evaluate performance:
- Server-side metrics measure the performance of the system from the server’s perspective. They include things like CPU usage, memory consumption, and network bandwidth.
- Client-side metrics provide insight into the end-user’s experience. They include things like HTTP response time, a measure of latency.
Load tests are focused on understanding how the user experience changes under heavy load. As such, developers typically track client-side metrics when performing load tests. Server-side metrics, on the other hand, are often obtained by system monitoring tools outside the load test’s purview.
The types of metrics that are collected depend on the target application’s use case. For web applications that use HTTP, metrics like HTTP response time and failed HTTP requests are useful. HTTP response time informs developers how long it takes their system to respond to user requests, while failed HTTP requests count the number of times user requests do not receive a response. An increase in either of these values could indicate that the target system is starting to regress.
In general, load testing tends to produce a large quantity of “noisy” data, meaning it lacks consistency and reliability which makes it difficult to discern trends. This is because load testing data contains wide variations, some of which can be attributed to factors unrelated to an application’s performance. For example, network latency can come from areas outside of an application’s control, and contributes to HTTP response time.
To deal with this, developers perform data smoothing, which involves some kind of data aggregation. One approach to aggregation is to take an average. However, the same factors that make data noisy means that the average isn’t necessarily indicative of the majority of users’ experience.
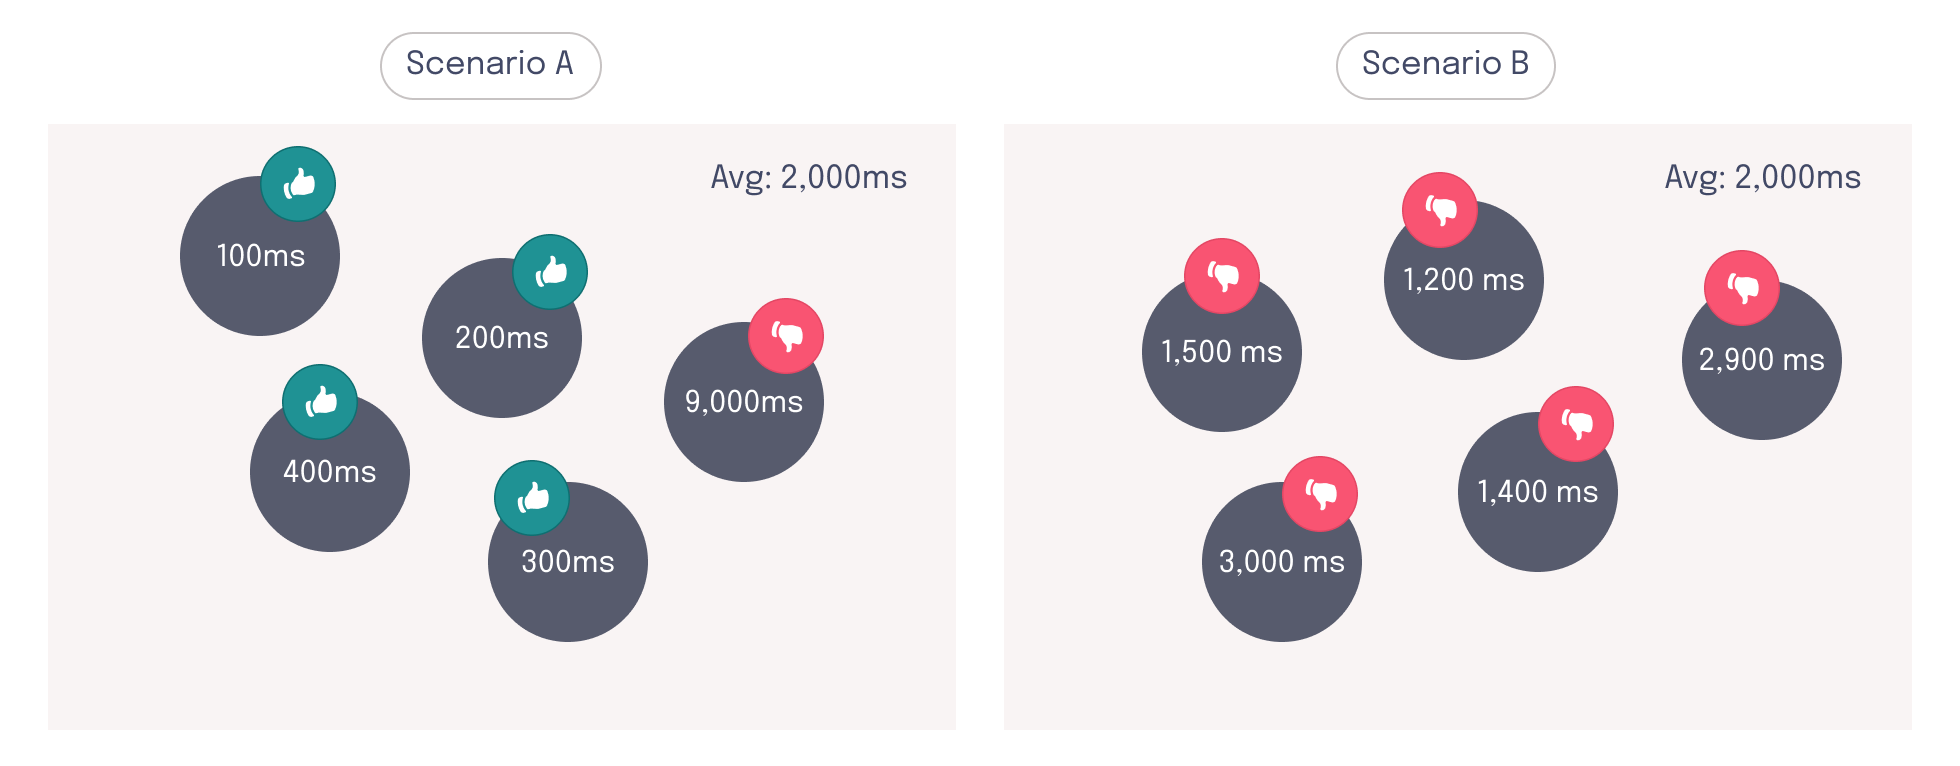
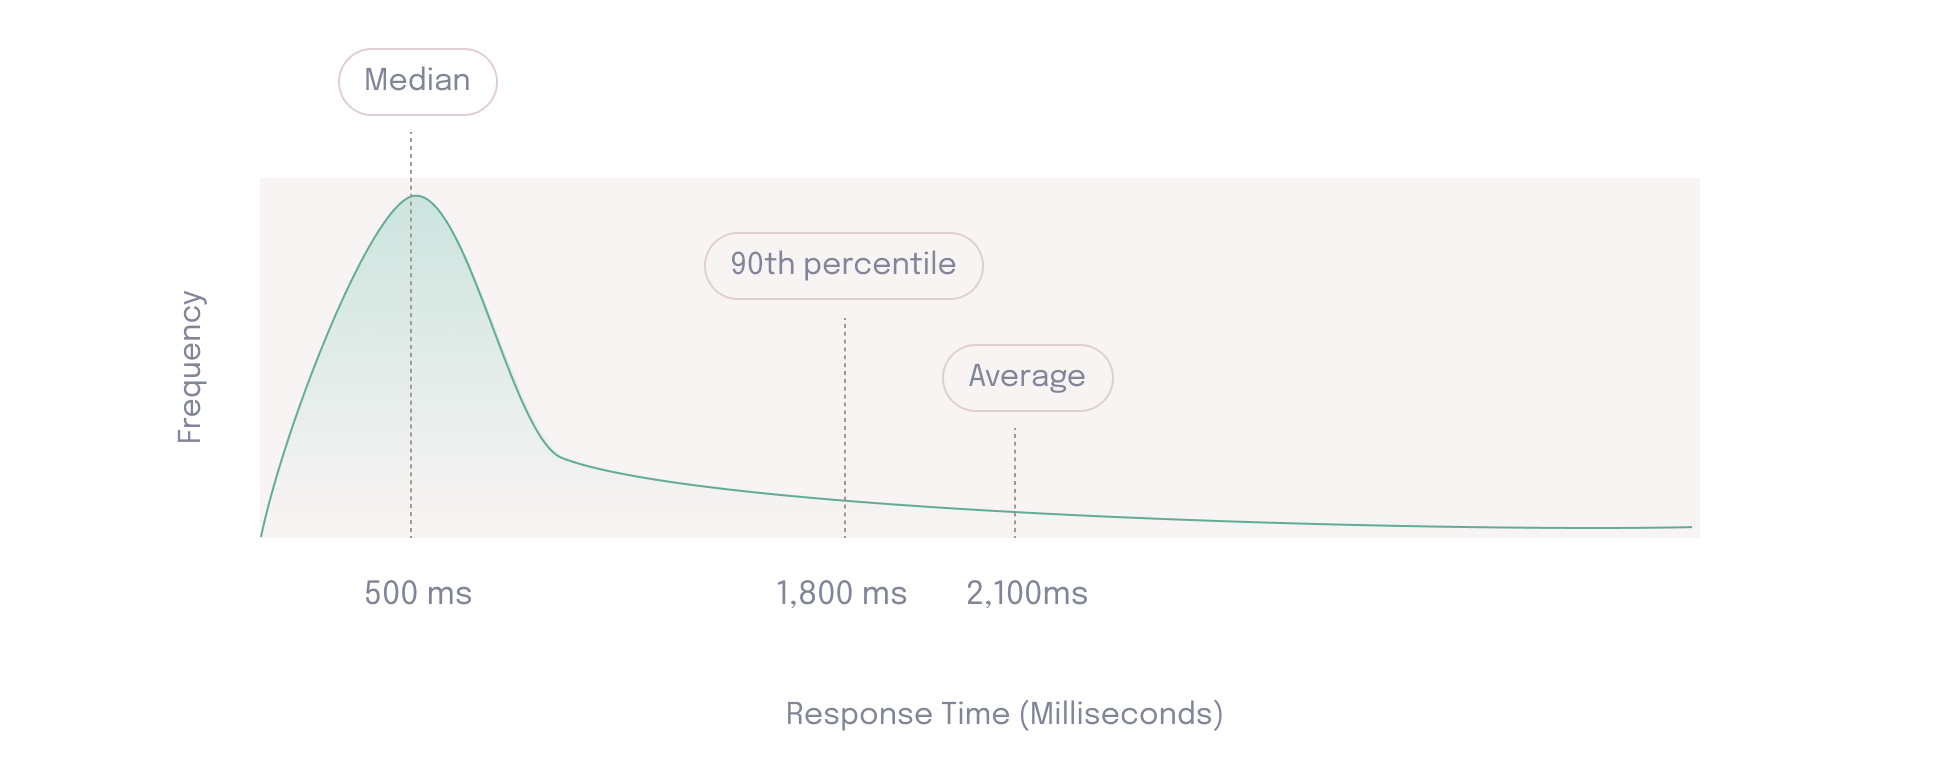
For example, both scenarios below have an average HTTP response time of two seconds, which represents a poor user experience. However, the experience of the majority of users across these scenarios is not the same. In scenario A, the majority of users have acceptable HTTP response times of less than half a second. In this case, a single outlier is skewing the average result. In scenario B, however, all users have an HTTP response time greater than one second, indicating a poor user experience across the board.
Because the average is often unreliable, it can be more effective to look at percentiles. For example, if the 50th percentile, also known as the median, is 500ms then developers know 50% of response times were lower than 500ms, and 50% were higher. Looking at the “tail end” (>90%) of percentiles can provide information about the worst-case performance scenarios. If the 90th percentile of response times is 1,800ms, it means that 10% of users have response times greater than 1,800ms. The experience of these users would not be apparent when looking at the median alone.
Therefore, it’s important to consider both the metrics that are being collected by the load test as well as how they’re being summarized.
iv. Visualization
Visualization is concerned with how data is displayed. One way to view load testing data is with an aggregated end-of-test summary. This makes results easy to parse and provides a high-level overview of how the system responded to the simulated load.
Running 30s test @ http://127.0.0.1:8080/index.html
  12 threads and 400 connections
  Thread Stats   Avg      Stdev     Max   +/- Stdev
    Latency   635.91us    0.89ms  12.92ms   93.69%
    Req/Sec    56.20k     8.07k   62.00k    86.54%
  22464657 requests in 30.00s, 17.76GB read
Requests/sec: 748868.53
Transfer/sec:    606.33MB
One drawback of this approach is that it lacks granularity. Because data is not plotted against a time axis, there’s not enough detail to identify when exactly problems start to arise and discern any trends.
Another drawback is that summaries are only generated at the end of a test. For a short test waiting for these results may not be an issue. However, load tests can be very long (sometimes they even take days). Displaying results in an end-of-test summary and forcing the developer to wait through the duration of the test hinders the usability of the load testing tool.
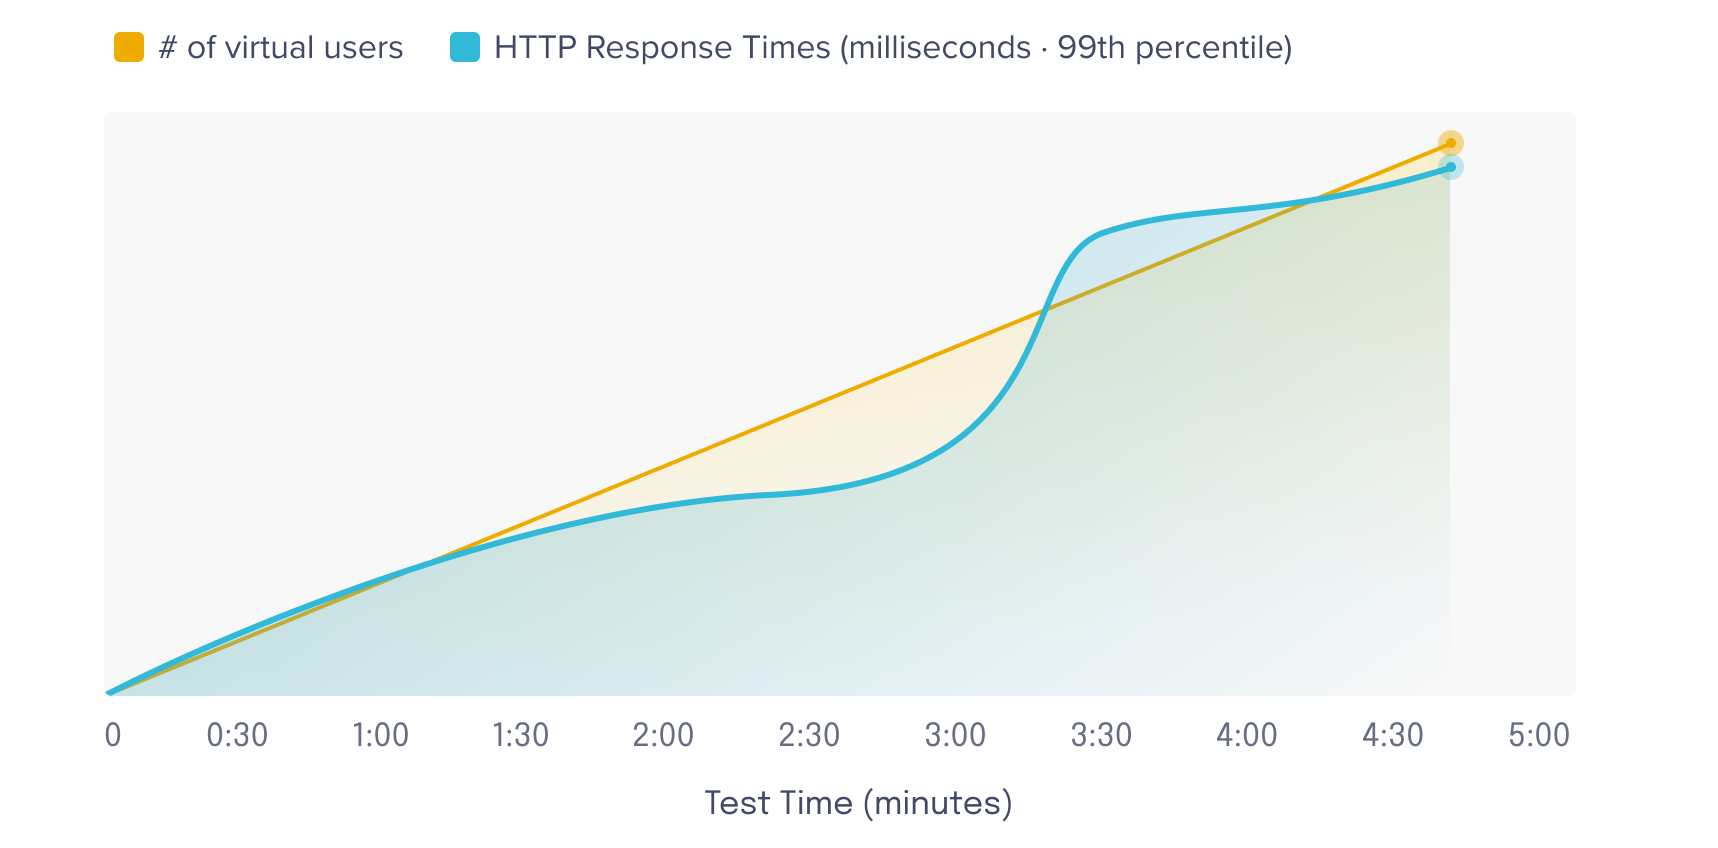
An alternative to end-of-test summaries is to use a visualization dashboard. These dashboards display data against a time axis, allowing the developers to have a better understanding of the data. For example, the graph below can be used to pinpoint the specific time system performance shifts, which occurs at about the three minute mark.
Moreover, these dashboards often display data in near real-time, allowing developers to react to live results as they occur. Depending on the nature of the load test, developers might either scale up server resources to handle the additional load or stop the test.
The main drawback with this approach is that near real-time processing is an engineering challenge, and may not be worth the additional complexity involved based on developer needs.
Summary
Load testing can involve many considerations. On the most basic level, developers need to consider the required scale of the load test, the protocol(s) being tested, the metrics being considered to evaluate performance, and how data is being visualized.
An application’s capabilities and complexity can introduce additional factors. For example, messaging applications and collaboration tools have specific characteristics that need to be considered when determining what load testing approach should be taken.
In the next section, we will take a look at how collaboration apps work and how these pose specific challenges that need to be answered by an effective load testing tool.
Background: Real-time collaboration apps
What are real-time collaboration apps?
Real time collaboration apps are applications that enable team members to work together, communicate, and collaborate simultaneously over the web. Real time collaboration apps can be categorized into various types based on their features:
- Messaging: Apps like Slack, Discord, or Mattermost allow users to join rooms or channels and talk to each other in real time.
- Whiteboarding: Whiteboard apps Miro and Whimsical give teams a visual platform to collaborate on brainstorming aids and graphic deliverables like mind maps or flow charts.
- Productivity: Coda and similar productivity tools empower teams to perform project management by collaborating on documents, tables, tasks, and more.
All of these tools benefit from low-latency data transfer (~100ms)6 and the ability for a server to push data directly to a client even in the absence of a request. Collaboration apps often rely on WebSockets to help them achieve these goals.
WebSocket is a protocol that operates over HTTP and uses the underlying TCP layer to create a persistent connection between client and server.7 Unlike HTTP, where the client must initiate communication with the server by first sending a request, WebSockets enables bi-direction communication between client and server. Although a WebSocket connection is initially established via an HTTP request, the protocol is subsequently updated to a persistent connection, allowing the server to stream events back to the client in real time.
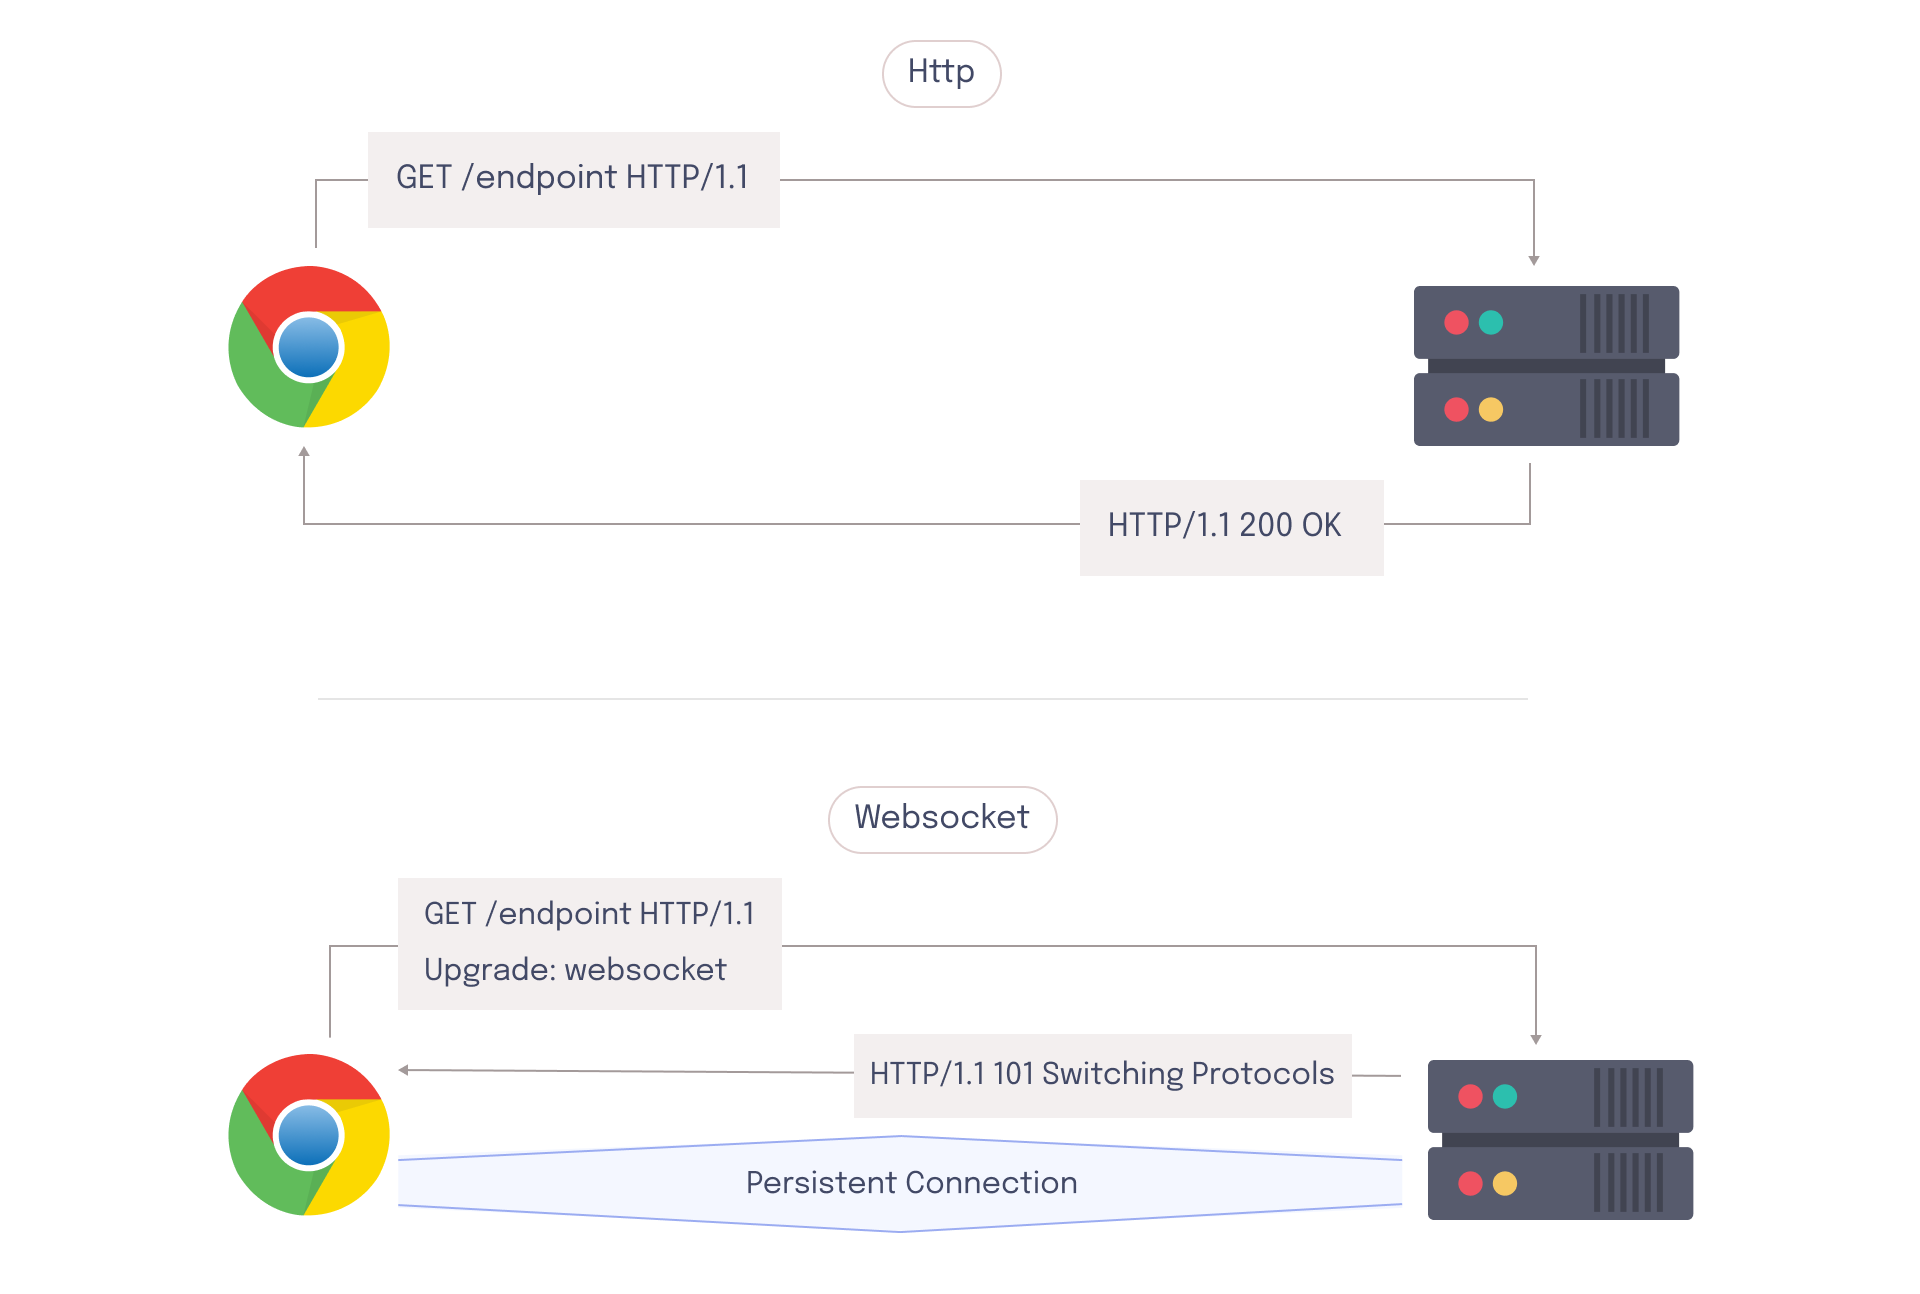
On the client side, a browser relies on a WebSocket object to facilitate this persistent connection. The WebSocket object uses event-based asynchronous callbacks to handle incoming messages from the server, and it can also send messages directly to the server. WebSocket messages, unlike HTTP requests, don't require a response.
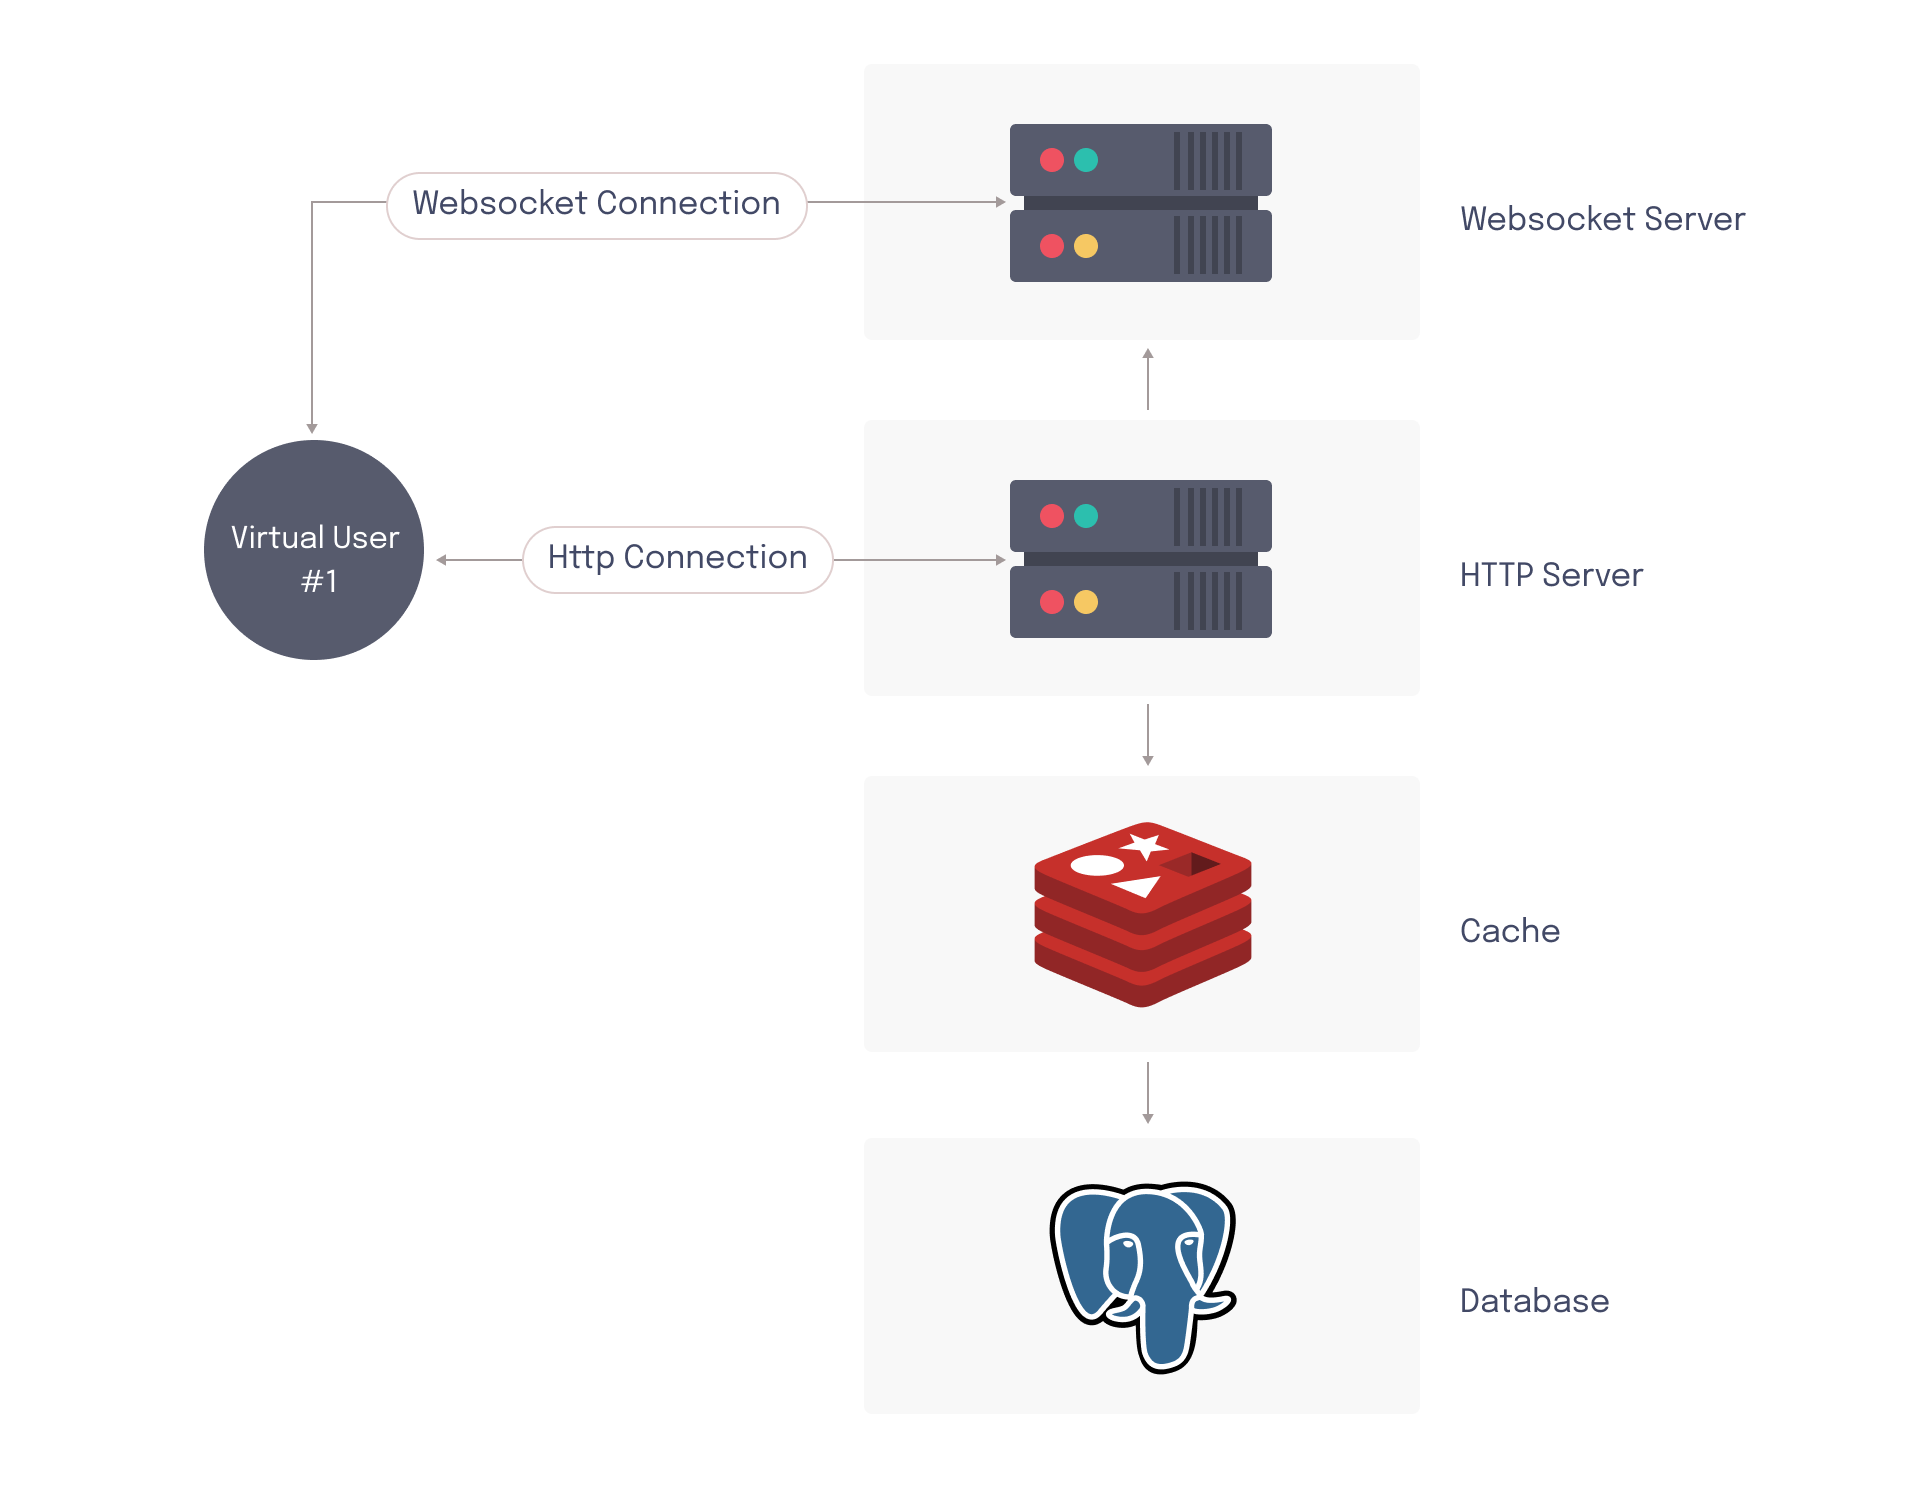
On the server side, a program must be running that’s capable of following the WebSocket protocol and listening for messages. This program is responsible for connecting to clients, sending and receiving messages, and managing the persistent connection. While it is possible to handle WebSocket and HTTP connections from the same host, developers often prefer to use dedicated services for each type of connection to improve scalability. This can increase the complexity of the architecture since traffic now exists in two places – the WebSocket server and the HTTP server.
Considerations when developing a collaboration app
WebSocket performance
WebSocket and HTTP are two distinct protocols, which means that developers require different metrics to measure their performance. HTTP operates on a request-response cycle, so developers often measure latency-related metrics like HTTP response time. WebSockets, on the other hand, does not require a response after the initial connection has been established. Since WebSocket messages often follow a “fire and forget” pattern, there’s less concern with how a “request” relates to a “response”.
The persistent connection of WebSockets necessitates additional performance metrics, such as the number of current connections and the number of dropped connections. Since the management of these connections requires server resources (like CPU and memory), unexpected surges in traffic can cause the server to get overloaded. Overloaded WebSocket servers may not be able to initialize new connections, which could result in client-side timeouts or connection failure errors. If resources are fully exhausted, the server might start dropping connections. Dropped connections can lead to degraded user experience, or in some cases even data loss.
Supporting separate protocols
Supporting two distinct protocols introduces significant complexity to the system. For example, HTTP and WebSocket servers may have different scaling needs. To determine the scalability thresholds of each, load tests need to be run that address both traffic patterns.
WebSocket clients exhibit different behavior from those that are connected via HTTP. When an HTTP server fails, traffic can be load balanced and redirected to another server the next time a request is issued (since HTTP servers are often stateless). However, if a WebSocket server fails, all clients are disconnected from that bi-directional communication simultaneously. Often, they all try to reconnect at the same time, which can create a "thundering herd"8 problem. Since WebSocket connections are initialized with an HTTP request, this could affect both the HTTP and the WebSocket server. Therefore, applications that support both HTTP and WebSockets need to be able to handle this.
Fan-out messaging pattern
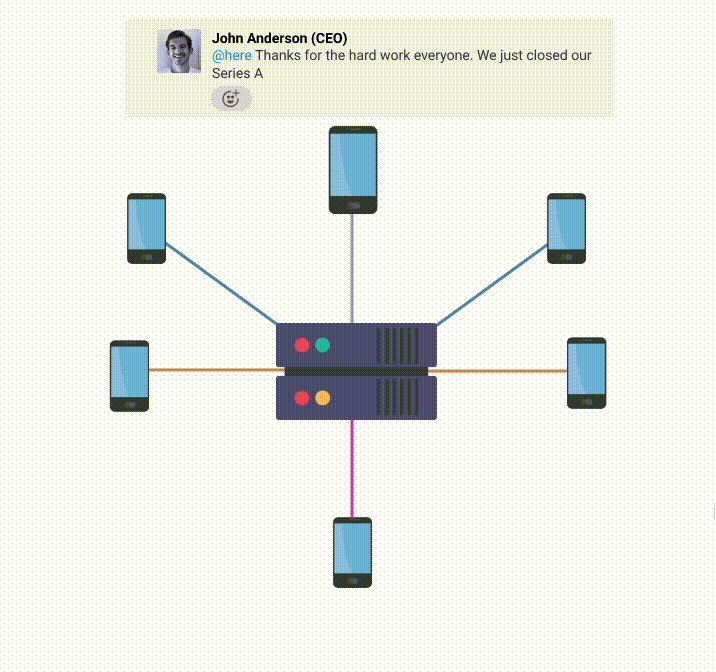
The fan-out messaging pattern uses a one-to-many arrangement to emit messages, which enables a collaboration app to distribute messages to all users connected to the same channel in real-time. A message could be a chat message, a user's mouse movements, entering text into a shared document, drawing something on a whiteboard, or any other sort of data that needs to be propagated back up to collaborators.
For these types of apps, the message can be published through an HTTP request or WebSocket message from the client. To enable real-time communication, messages are sent back up to subscribed collaborators via WebSockets. Depending on how large the channel is, one published message can lead to a sizable fan-out.
For example, if a user sends a message to a Slack channel with 1k subscribers, the single POST request that sends the message turns into 1k WebSocket messages being emitted. That’s not necessarily where the fan-out ends, however. If other users start liking or reacting to that message it can compound the problem. Each time a user reacts, it creates a new message which has to be sent back out to all 1k users in the channel.
This could lead to a large amount of fan-out where the WebSocket server might be required to send out one million messages (1k likes times 1k clients). Since all of this is supposed to be happening in real-time, all of the messages need to be sent out very quickly. This can place a significant burden on the WebSocket server, since it needs to accomplish all this work in a short period of time.
Summary
Managing a real-time collaboration app poses a unique set of circumstances that developers must take into consideration. WebSocket servers and clients behave differently than their HTTP counterparts, so additional scenarios like WebSocket performance, thundering herds, and fan-out messaging must be accounted for. To ensure readiness for these scenarios, developers should perform load tests that accurately simulate these behaviors.
Load testing for collaboration apps
The rise of remote work has led to a surge in popularity for real time collaboration apps. For example, Miro grew from 12k to 100k concurrently connected users in less than one year.9 This type of rapid growth requires scalability, which can compound the challenges listed in the previous sections.
A load testing tool built for these types of applications should have a certain set of characteristics to be effective.
- Load tests need to ensure that all components of the architecture are tested, meaning that virtual users should be able to mimic both HTTP and WebSocket clients.
- Load tests should be capable of generating at least 100K virtual users per test to support the needs of medium-to-large collaboration apps.
- Load tests should be able to collect and display granular data pertaining to both HTTP and WebSockets. To ensure that developers can react to potential issues or stop a test while it is running, this data should be displayed in near real-time.
Generating HTTP and WebSocket traffic
Typically, the HTTP server and WS server need to be tested in tandem to get an accurate picture of how the system responds to load from real end-users. For applications that only support HTTP endpoints, an HTTP load tester is sufficient. However, collaboration apps cannot rely on HTTP requests alone for load testing, since client traffic is divided between two different protocols. HTTP-focused load tests do not cover all components of a collaboration app’s architecture.

In an HTTP load test, requests are sent to the HTTP server. In response, this causes data to be sent to the WebSocket server so that published messages can be propagated to subscribed end-users. However, if the virtual users in the load test do not maintain persistent WebSocket connections, the WebSocket server never has to emit any messages (since there are no active subscribers). This means that a critical part of the architecture never has to sustain any load.
Due to fan-out messaging, the number of WebSocket messages that must be sent (and therefore, the amount of load the WebSocket server must sustain) can be orders of magnitude different from the number of HTTP requests being received. It is important that the virtual users in the load test accurately simulate the persistently connected WebSocket clients.
Scaling to 100K+ concurrent users
Collaboration apps have different needs for load tests, as the number of daily active users varies from company to company. For example, Miro grew from 12k to 100k concurrently connected users in less than a year. 9 Another large real-time collaboration app we contacted privately indicated they were running load tests of up to 100k concurrent users. For Slack, load tests range from 5k to 500k virtual users.10 Based on these numbers, we believe that an effective load tester for medium-to-large collaboration apps should be able to run load tests in the six-figure range (at least 100k virtual users).
Running load tests with 100K+ virtual users will quickly outstrip the compute resources available on a single machine, and will therefore require a distributed architecture. While it’s possible to run distributed load tests using on-premises servers, developers will often run load tests on servers hosted by cloud providers like AWS. This provides greater flexibility and scalability, allowing developers to quickly provision and deprovision resources as needed for testing without additional hardware investments. That being said, distributed cloud-based load testing adds additional complexity and requires both management and coordination of cloud infrastructure.
One of the major concerns with distributed load testing involves the synchronization of load generators running on separate hosts. Load tests often have a predefined pattern for ramping the number of virtual users up and down. Different patterns test how systems respond to different scenarios.
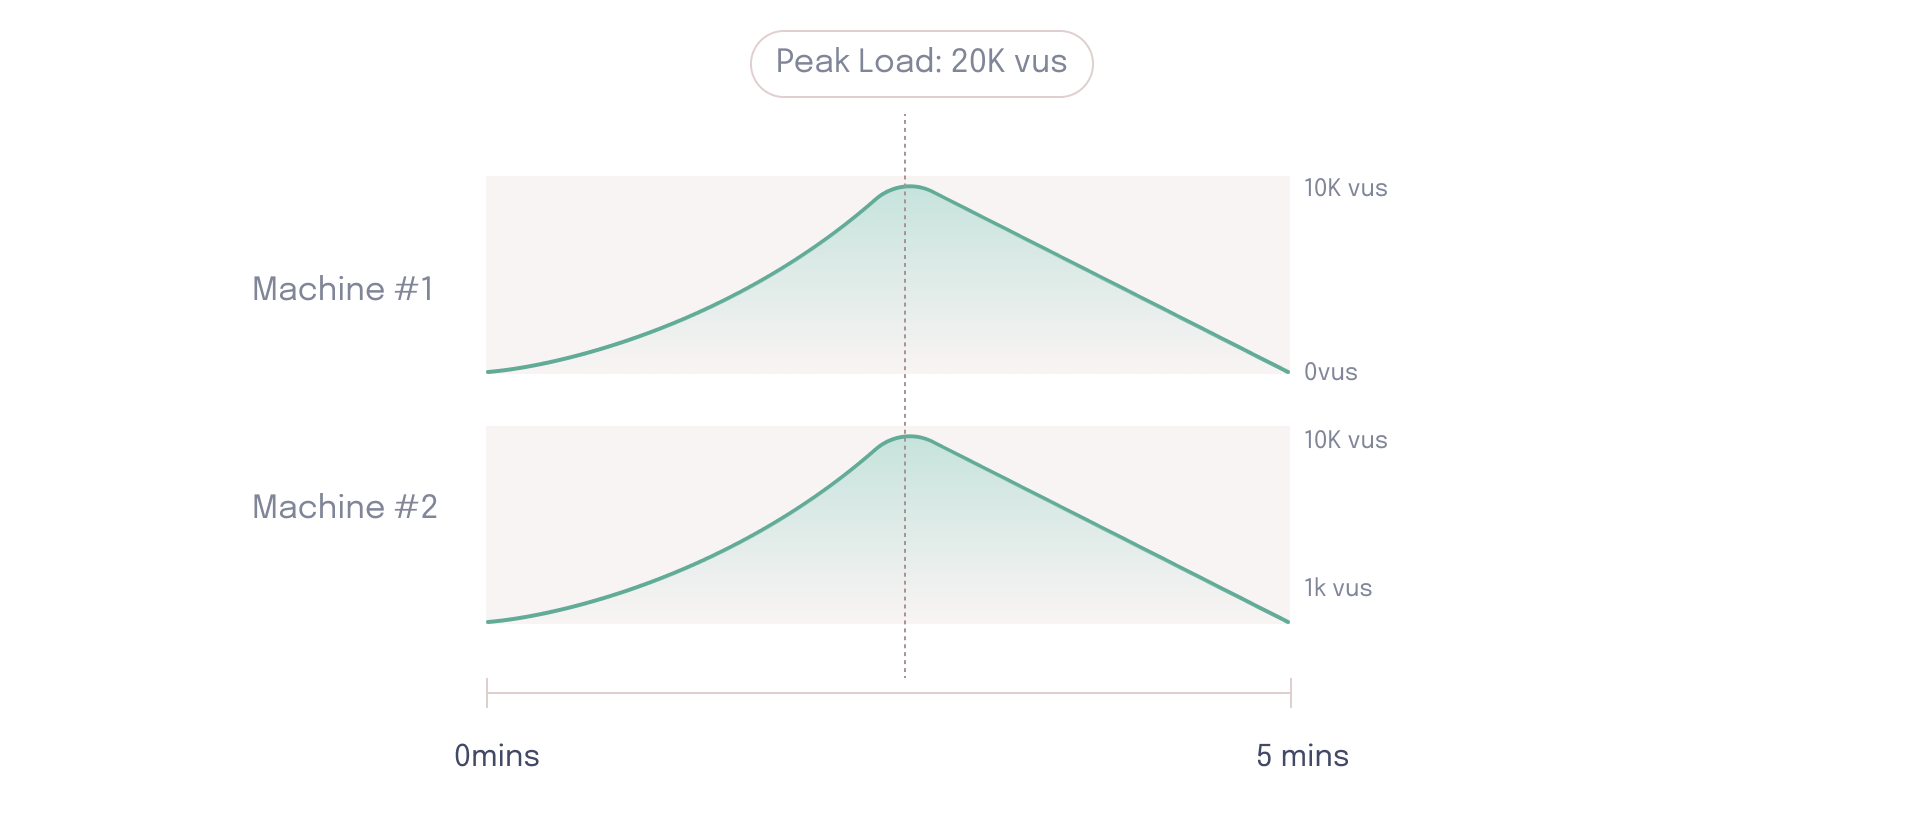
In the example below, both load generators are ramping up to a peak load of 10k virtual users, and since the tests are synchronized they will reach a combined peak of 20k virtual users for the load test.
However, if one of the load generators is out of sync, the overall test will never hit the peak load of 20k virtual users.
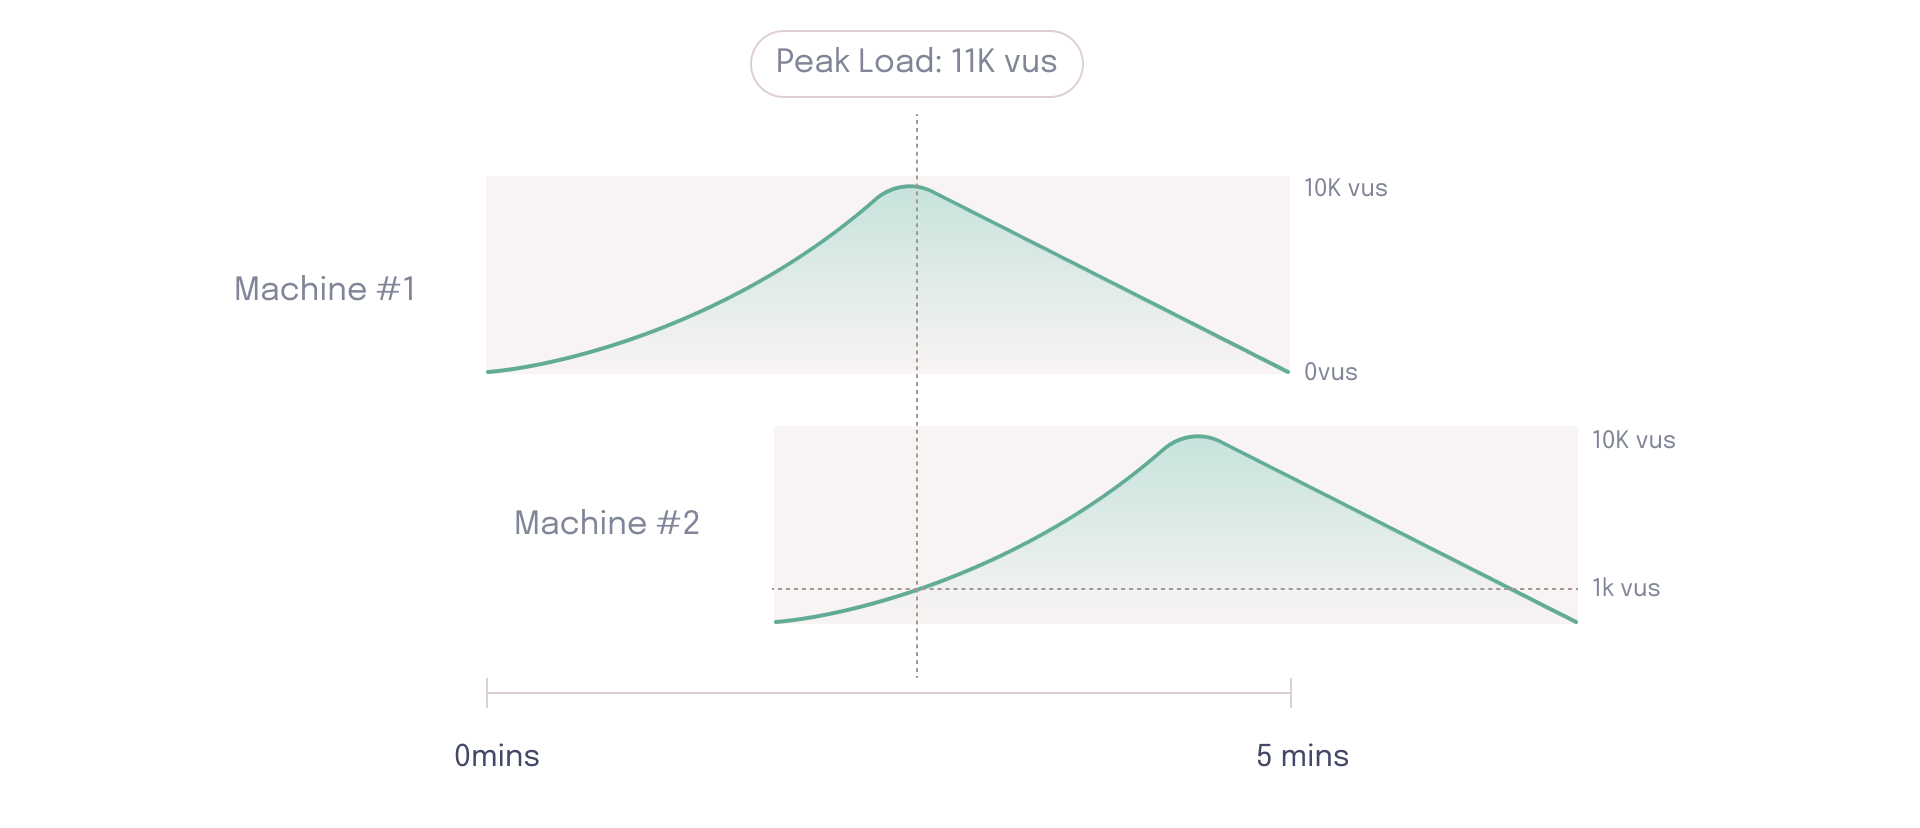
This is a major issue, especially if developers are trying to test for a specific load that never gets simulated. Therefore, an effective load testing tool needs a way to synchronize load generator nodes to ensure they all start ramping up the load at the same time. Without such a synchronization mechanism, there is no way to guarantee the load test is simulating the predefined pattern of user load.
Collecting and displaying data in near real-time
Finally, an effective load testing tool for real-time collaboration apps should be able to display data in near real-time. This enables developers to run load tests against a variety of environments.
Often, staging environments are used to mirror production environments. This provides a level of isolation that enables load tests to be conducted without fear of taking down any critical production services. That being said, developers may still want to run tests against production for a number of reasons:
- Running load tests against production often yields the most accurate results.11
- Some companies may not have the time or financial resources to implement a full duplicated staging environment.
- There may be overlapping resources between staging and production, in which case running a load test against staging could still affect critical production components.
Running load tests against production comes with a variety of risks. The additional load might cause performance of the application to degrade for real end-users. For example, the application could become unresponsive, unreliable, or even crash. In the worst case scenario, running load tests against production can put stress on the underlying database, resulting in data loss or corruption.
A near real-time load testing dashboard allows developers to monitor load test results to ensure that they’re not degrading end-user experience on their production application, and allows them to stop the test entirely if the production server starts to get overwhelmed.
To facilitate this near real-time visualization of data, the load testing tool should perform stream processing rather than batch processing. Batch processing presupposes the data has a defined start and finish, meaning that batch processing delivers results like end-of-test summaries.12 This does not allow developers to act upon results while the load test is running.
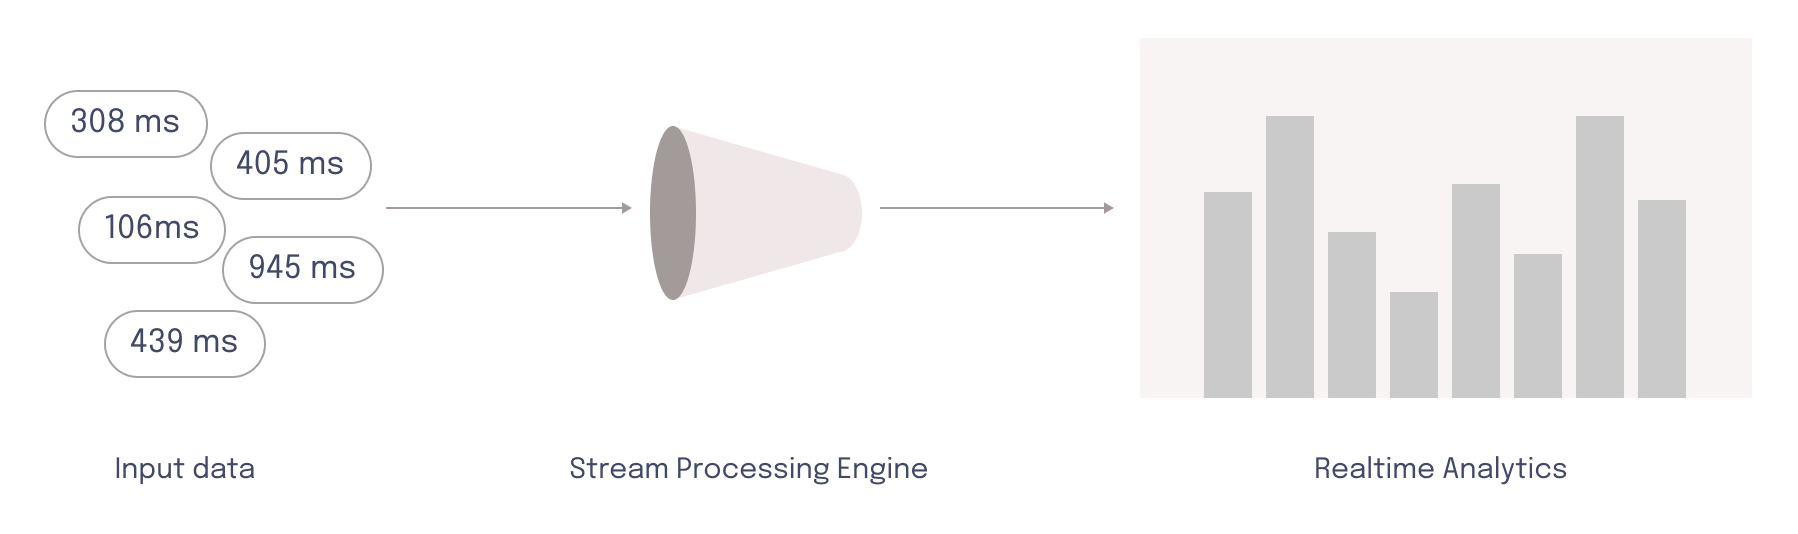
Stream processing, on the other hand, assumes data is unbound and arrives continually over time.12 To derive analytics like percentiles from a data stream, the system splits data up into time intervals. All the data points that fit into one of these “windows” are aggregated and sent to storage. This comes with challenges of its own.
The amount of data depends on a variety of factors, including the type of load test, which load testing tool is used to conduct the test, which metrics are being collected, and how frequently they are being collected. For example, a test in which virtual users are making HTTP requests each second would result in a higher amount of data than a test in which a request is made every ten seconds.
If load tests are very large, the amount of data output could overwhelm the resources available in the stream processing pipeline. In this case, the stream processing pipeline needs to vertically or horizontally scale to deal with the amount of data, without diminishing accuracy or reliability of that data.
Finally, a load testing tool needs a storage method and an effective visualization tool that can display all this data in an understandable way. The visualization tool can then continually pull from the storage as data flows into the system, allowing developers to see data in near-real time as they execute the test.
Existing solutions
There are many existing solutions for load testing tools like k6, Locust, JMeter, and Artillery. While all these companies offer open-source load testers, they are typically meant for local use, meaning resources for producing high numbers of virtual users are limited to one host. However, our specifications require supporting at least 100k users per test, which necessitates a distributed architecture composed of multiple hosts.
It is possible to use an open-source tool in a distributed manner, but it involves managing all the necessary cloud infrastructure yourself. For example, in this approach developers running the test would be responsible for setting up the infrastructure to run a distributed test, collecting streaming data from multiple sources, storing all the data in a database, and setting up visualization tools to display the data. Some tools, like JMeter, offer guides13 and a controller construct to help users run distributed tests. If a company has very specific needs, it may consider developing a self-hosted DIY tool rather than extending the capabilities of an open-source tool by distributing the test.
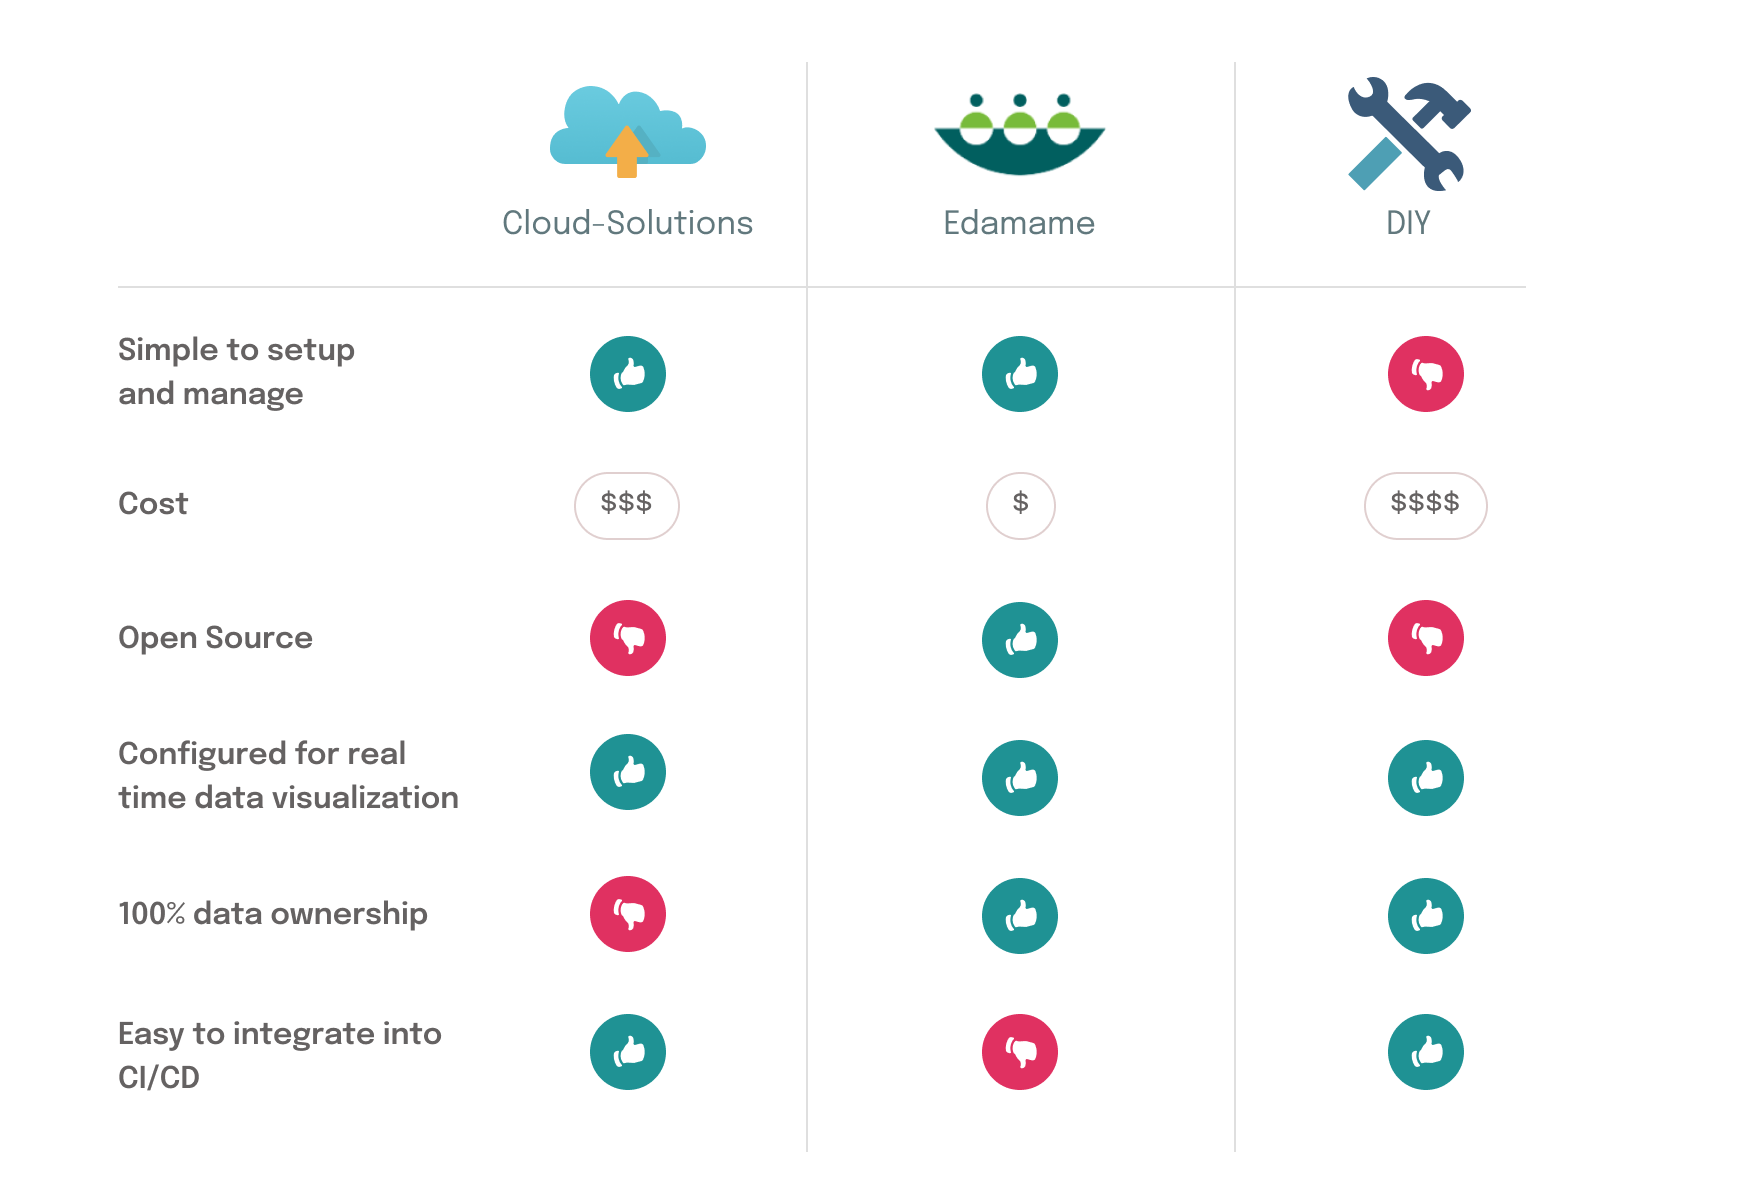
This approach, however, involves significant complexity. Many open-source load testing tools offer managed cloud-based services that abstract away all the challenges of distribution. While this is a convenient option, it does come with limitations such as lack of data ownership and high cost.
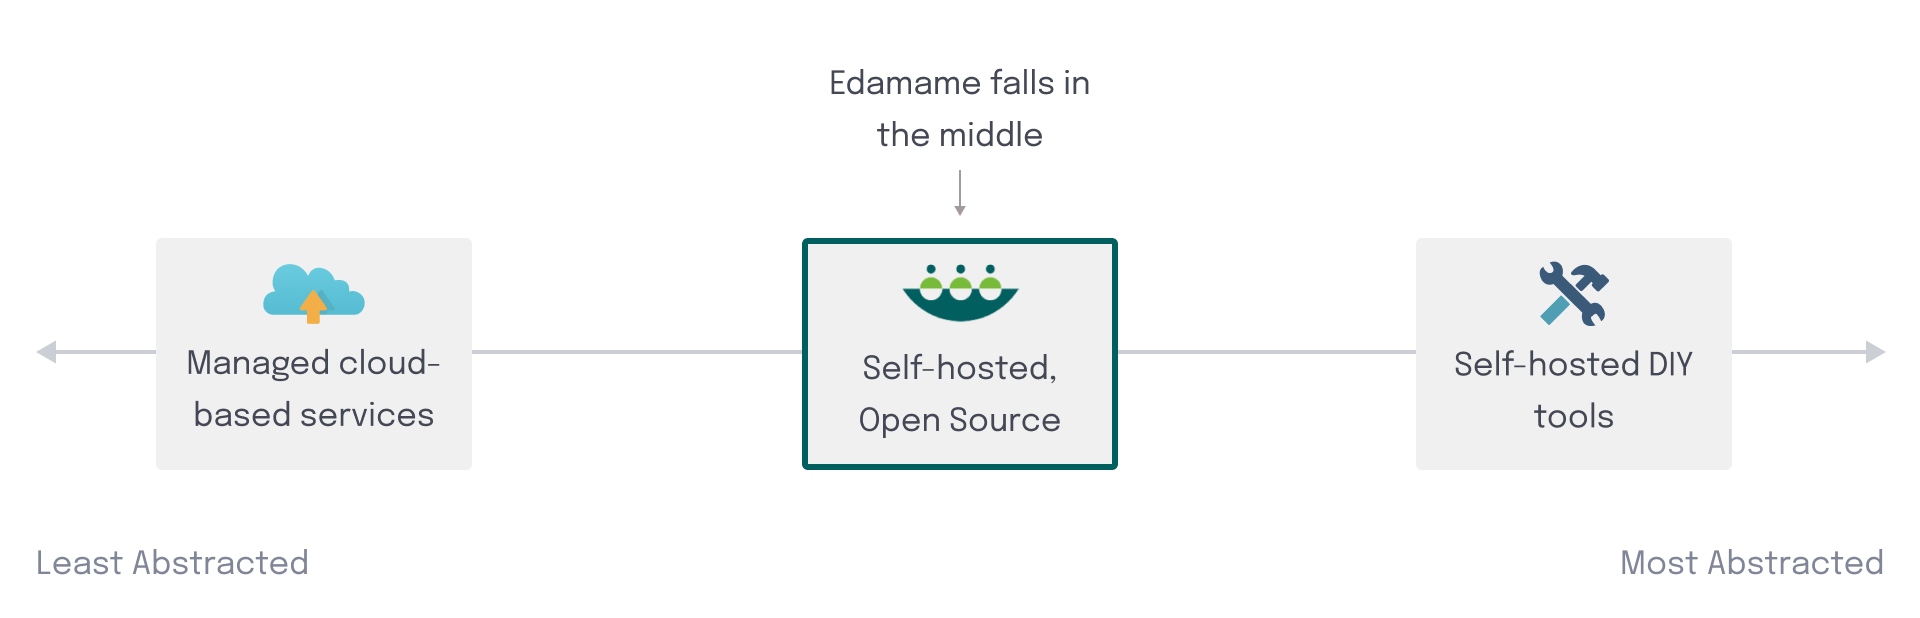
Edamame is one of a few solutions that belong between the two different levels of abstraction of self-hosted DIY tools and managed cloud-based services. It provides a load testing tool with built-in distribution management that's simple to deploy and run.
DIY
Several real-world collaborative apps have taken a DIY approach to either develop a custom load testing tool or extend an existing open-source tool and manage the distribution.
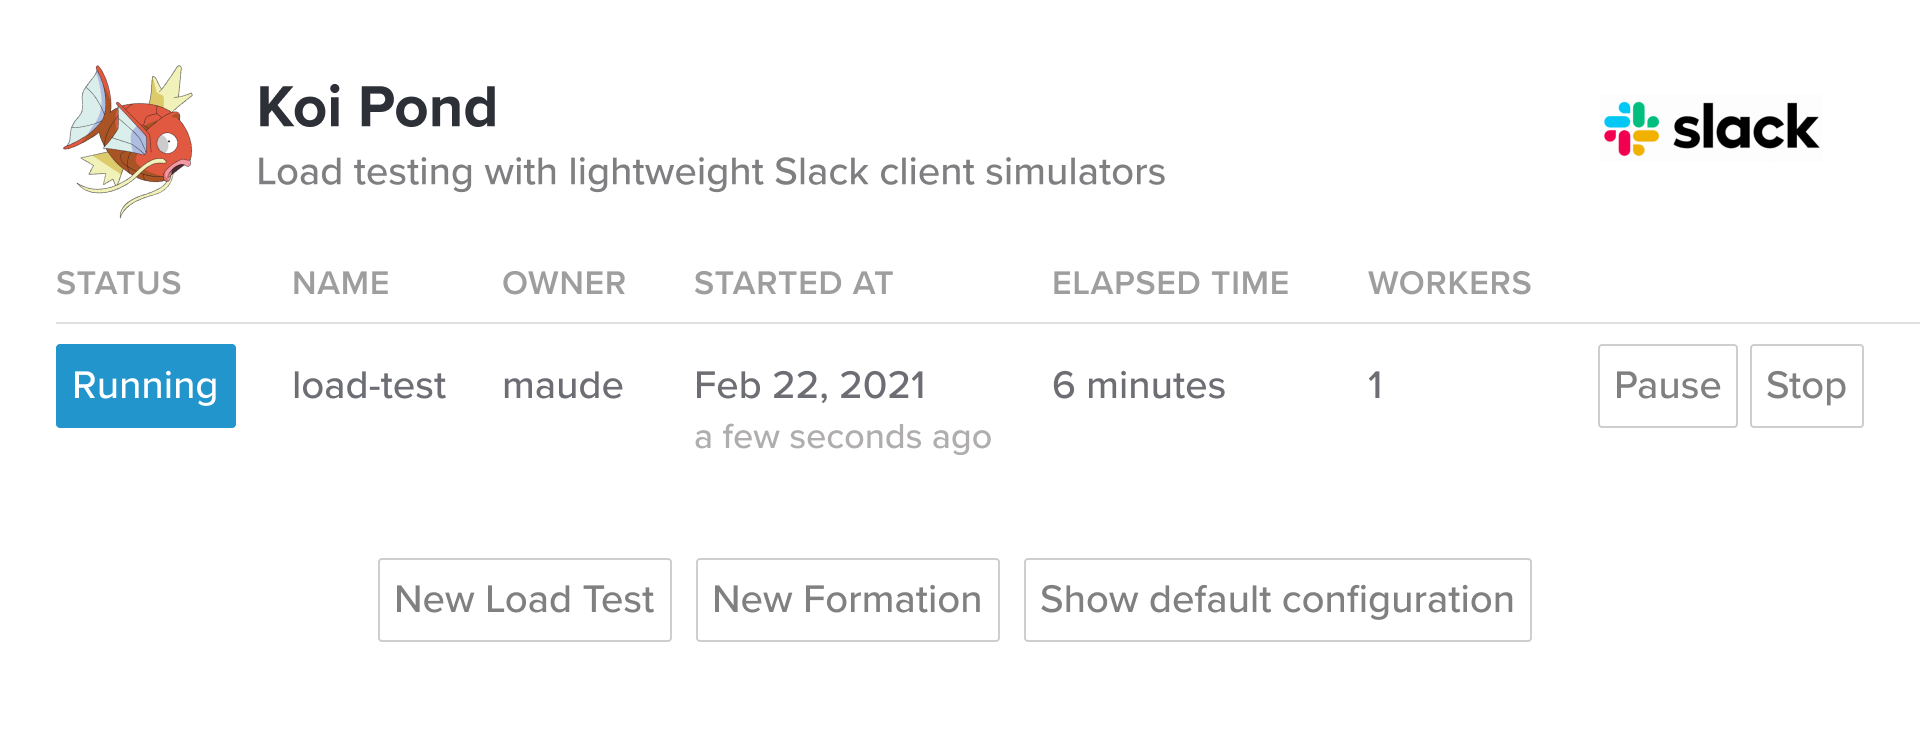
Slack built Koi Pond10, which is an internal tool that leverages a distributed Kubernetes architecture to ensure sufficient connected virtual users. Load is generated using a custom tool written in Go, and virtual user behavior is dictated by a JSON file. Koi Pond streams data which is displayed in a Grafana dashboard as a test runs.
Miro facilitates WebSocket load testing by extending JMeter with a plugin and custom scripts. To mitigate the costs associated with running load tests on AWS, they use temporary Spot instances which are only active for the duration of the test.9
Neither of these two tools, however, are available for public use. They represent proprietary technology that’s only available at the company that specifically developed them.
For developers looking to build their own framework for running distributed load tests, AWS14 and Google Cloud15 both have guides on how to manage the underlying infrastructure to facilitate this. In this approach, the developer takes on all responsibility for the challenges associated with running a distributed test.
Managed cloud-based services
If a developer does not wish to manage the complexity involved with a distributed load test, using a cloud-based solution abstracts away many of the challenges involved. Cloud-based solutions are paid services that handle all underlying infrastructure for running tests, data collection, data processing, near real-time visualization, and data storage. This makes it very easy for developers to run large-scale load tests.
That being said, cloud-based solutions also have their trade-offs. They can be very costly.16 Moreover, because all data storage is managed, users do not retain control over their own data. Different cloud-based solutions will place different limits on how long data is retained.
Another issue is that cloud-based solutions are not very flexible. For example, the k6 open-source load tester is quite extensible, which allows developers to customize which metrics their load tests are tracking by default. However, the k6 cloud platform does not support utilizing these extensions,17 which compromises developer experience.
An in-between
Developers can also use a self-hosted tool to run distributed load tests. These enable users to run distributed tests on their own infrastructure, and are typically either open source or licensed software. This approach is less abstracted than managed cloud-based services, but more abstracted than a proprietary DIY tool.
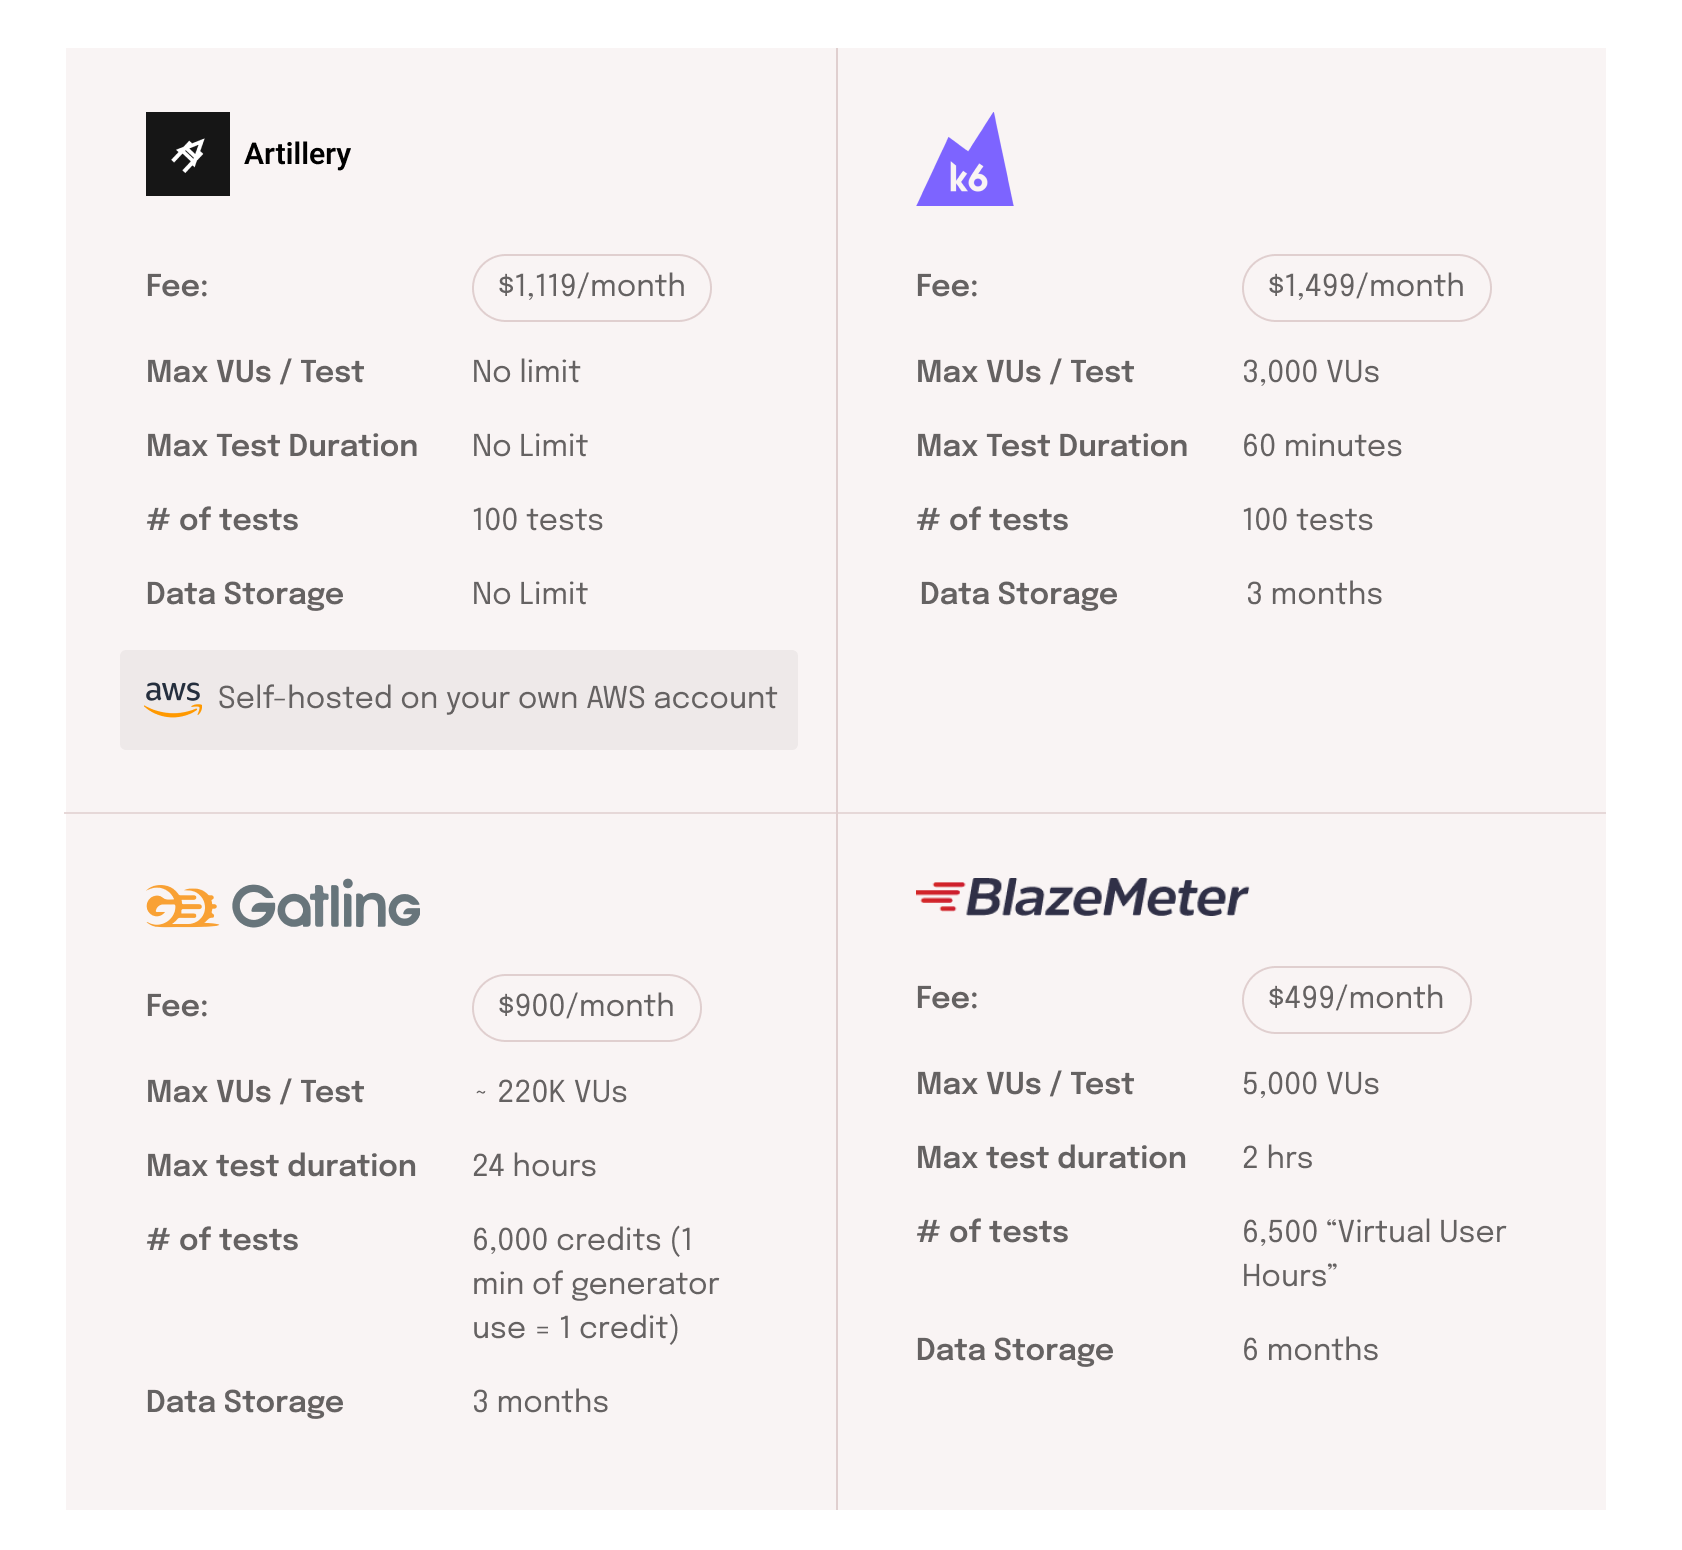
Artillery is one example of an open-source tool that allows for distributed load tests that are easy to deploy;18 however, it comes with significant drawbacks. Tests are run on the user’s AWS account using AWS Lambda (AWS's serverless function offering), which limits them to a 15-minute duration. Distributed load tests run using Artillery also cannot be stopped mid-test.
Gatling Enterprise’s licensed tool is another example of a self-hosted solution. In this case, developers can pay a licensing fee to use Gatling’s software on their own infrastructure. The software takes care of running distributed load tests, but not the management of the underlying architecture, data storage, or other external considerations.
Edamame lives in the liminal space between a DIY and a SaaS solution. It’s open-source and provides many of the benefits of a cloud-based service such as managed distribution and near real-time data visualization. It also addresses the primary limitation of these services by giving users full control over their data. Edamame is built with collaboration apps in mind and features meaningful metrics for both HTTP and WebSockets out of the box.
Edamame is a specific tool built for a specific use case, so it has limitations as well. Applications that need to support high levels of concurrency may not wish to utilize Edamame, as it does not support more than 200k virtual users per test. Edamame does not integrate into a CI/CD pipeline like GitHub Actions or Jenkins. Because Edamame targets collaborative apps, it does not support protocols outside HTTP and WebSockets.
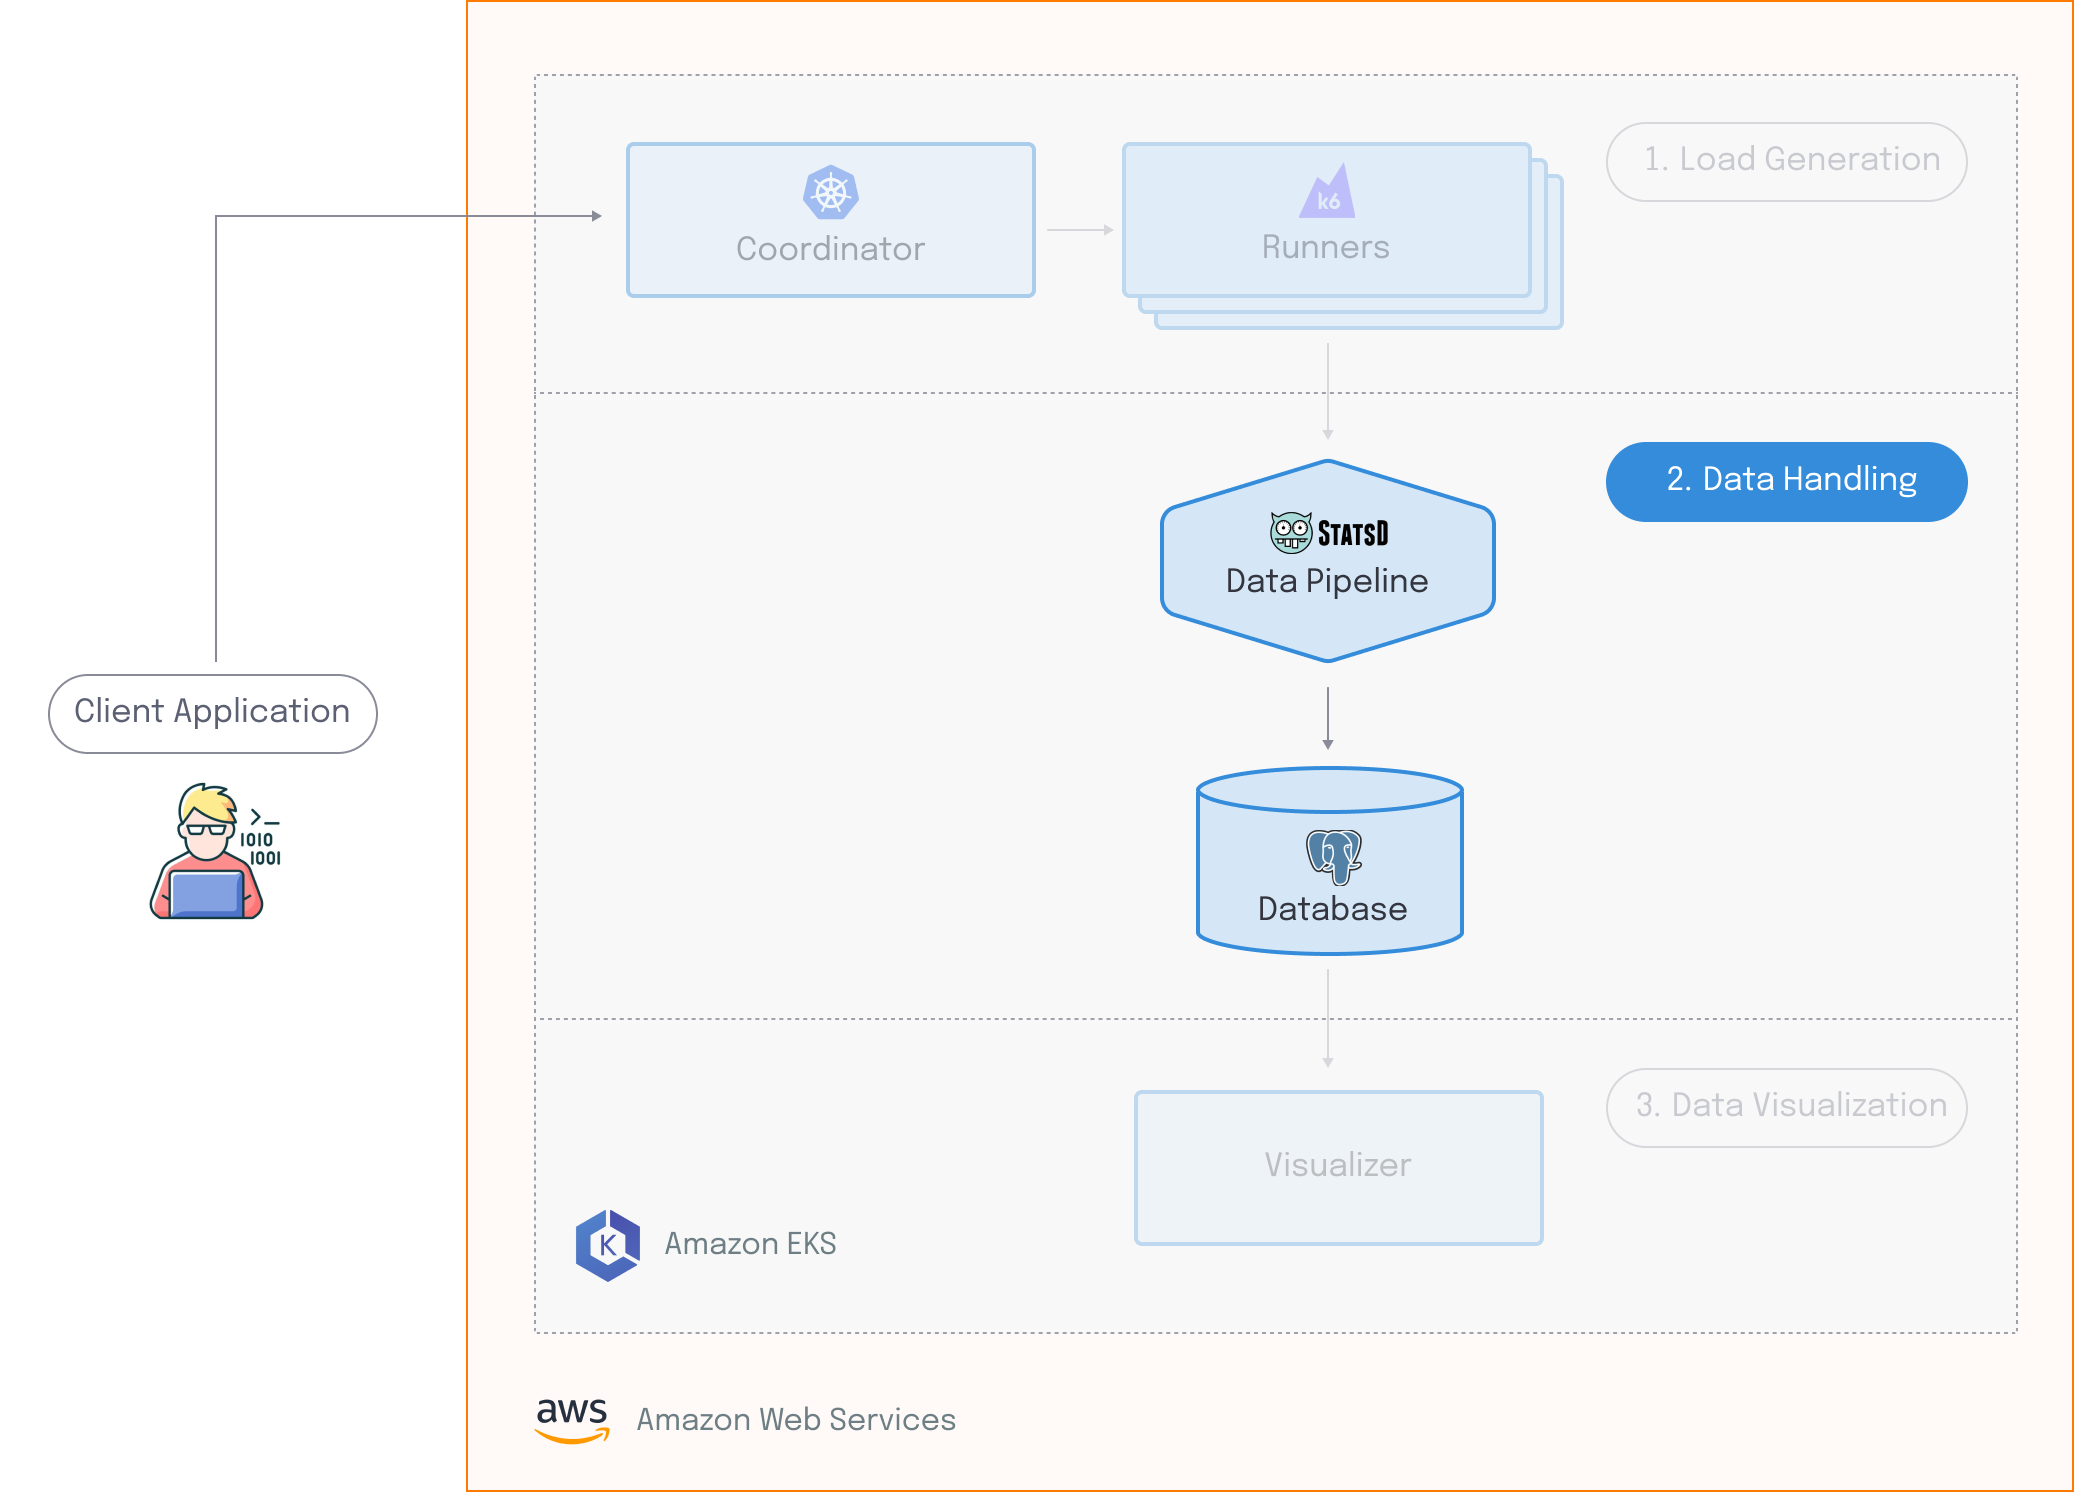
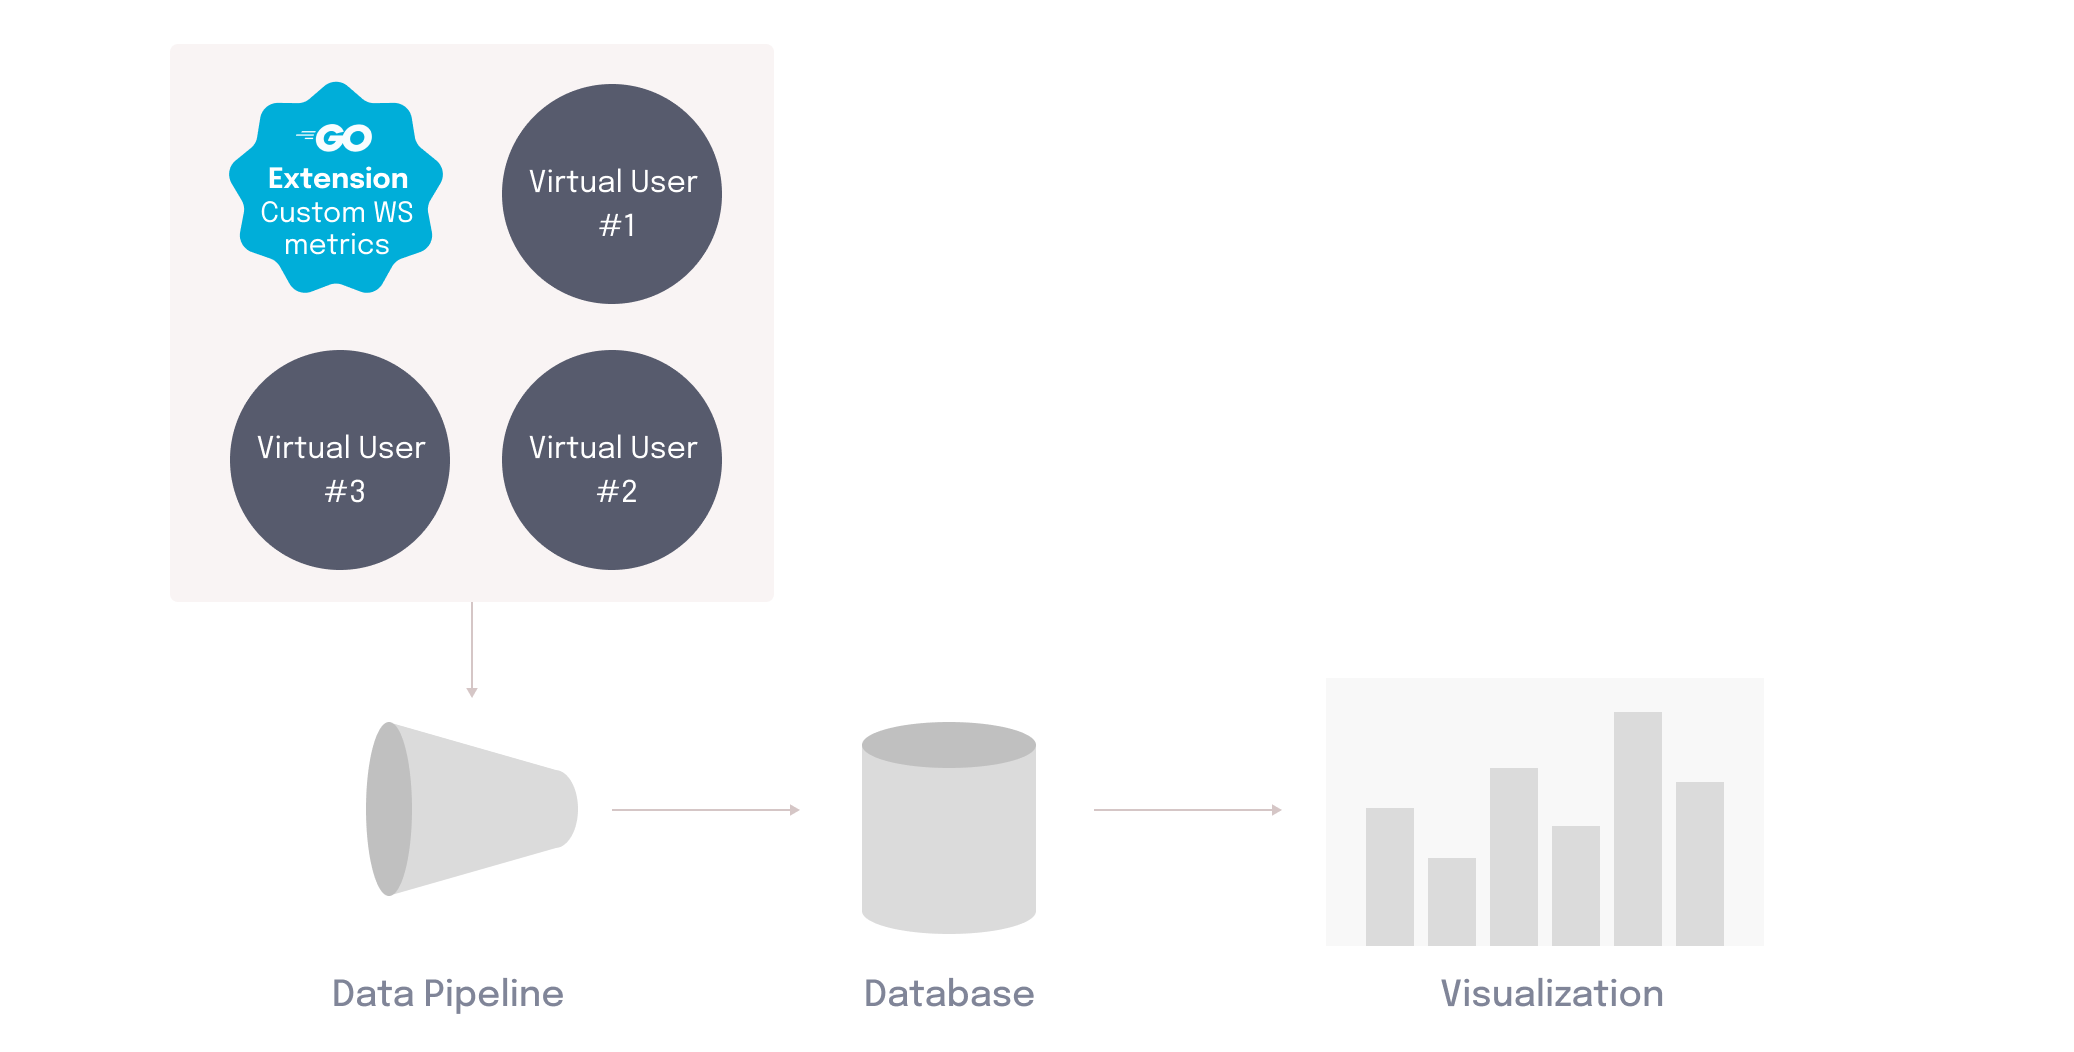
Edamame architecture
Edamame has three major components:
- The Load Generation component is responsible for simulating virtual users across multiple hosts. This consists of two entities: the runners generate HTTP and WebSocket traffic which creates artificial load on the target system and the coordinator ensures that the runners are synchronized.
- The Data Handling component is responsible for receiving, processing, and storing the data emitted by the load generation component.
- The Data Visualization component provides a custom dashboard that allows for meaningful analysis of test results in near real-time.
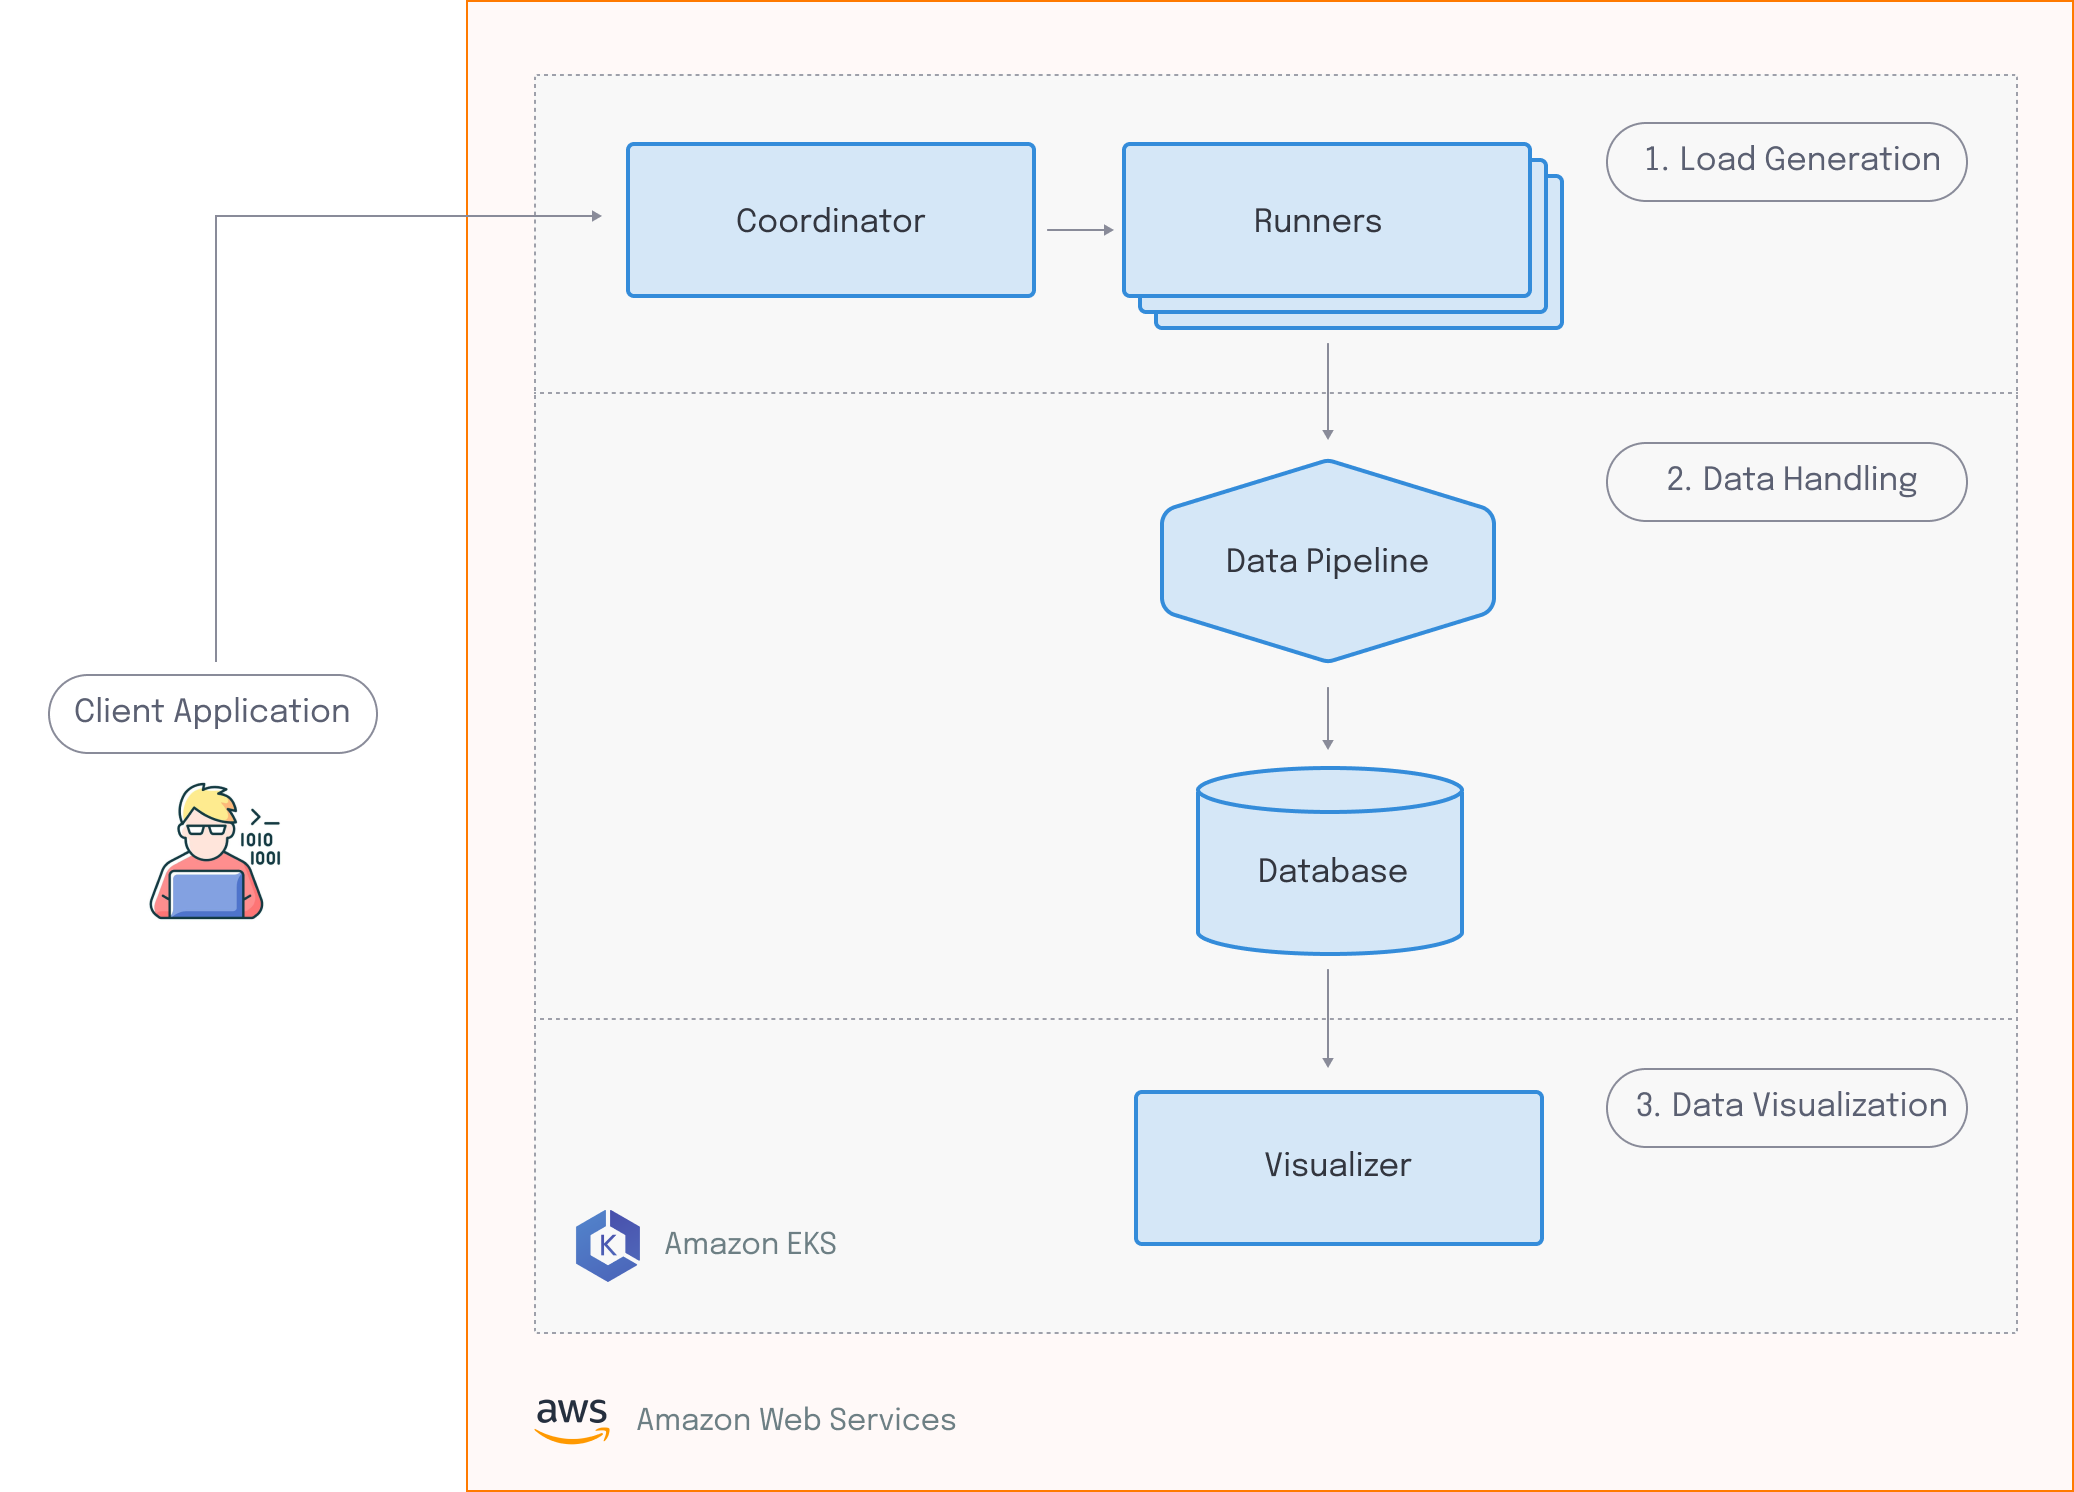
Edamame runs on Amazon Web Services, or AWS. Before the user can run any tests, all the necessary infrastructure is deployed to their AWS account.
To run a test with Edamame, the user must provide a test script. Edamame evaluates this test script, and scales up the resources needed for the runners and the data pipeline. When this is ready, a signal is sent to the coordinator, which enables the runners to execute the given test script in a synchronized manner. Client-side data output by the runners gets sent to the data pipeline, where it gets processed, and then sent to the database for storage. Finally, the visualizer grabs the data from the database, which gives the user access to a dashboard that they can use to see live results.
Once the test is complete, test runner and data pipeline components are scaled back down, and Edamame goes back to its initial “resting state”.
Building Edamame: Load Generation
We’ll start off by talking about the “Load Generation” component of our architecture, which involves generating load and coordinating distributed load tests.
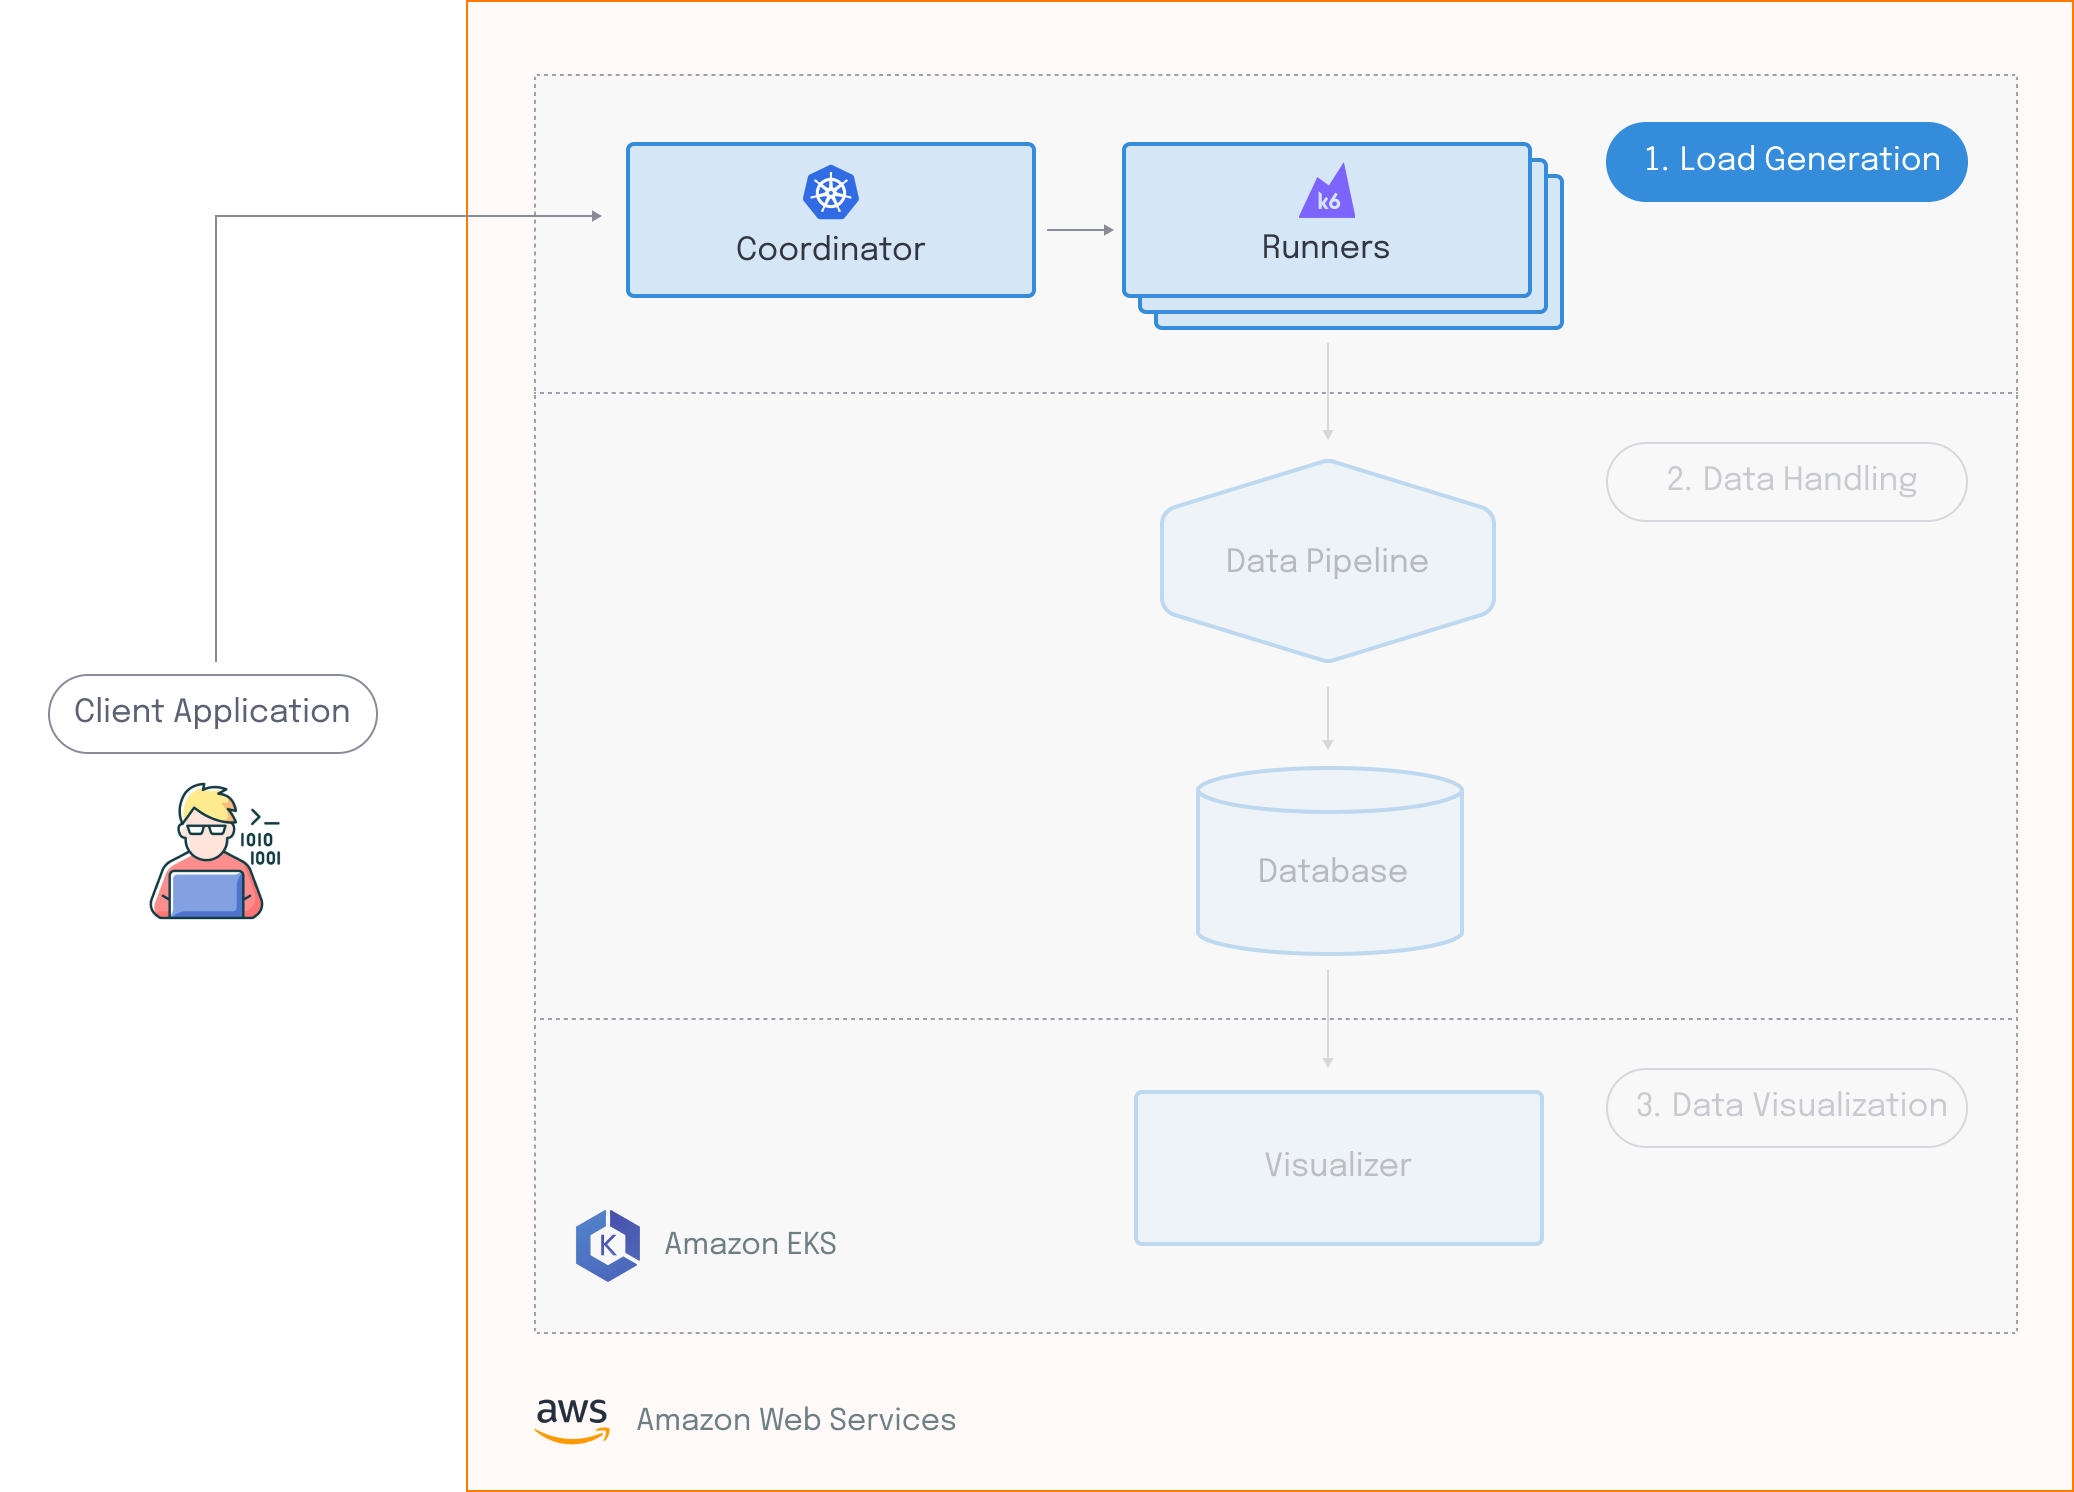
Scaling to 100k+ virtual users
Since the target developers for Edamame require the ability to run load tests of at least 100k concurrent virtual users, a distributed architecture is required. Distributed load tests require multiple hosts to have a load testing tool installed. However, manually installing and configuring that tool on a potentially large number of hosts is inefficient, error prone, and difficult to maintain.
To get around this, developers can use containers, which duplicate applications along with their environment and dependencies for efficient deployment to multiple hosts. Therefore, Edamame leverages containers to distribute multiple instances of the selected load testing tool. These containers run on Amazon’s EC2 instances in the user’s AWS account.
The question then became; which load testing tool should Edamame utilize for its distributed tests? There are many open source load testing tools available that fit our use case to varying degrees. We looked at two main considerations:
- The load testing tool should be able to generate traffic for both HTTP and WebSockets in order to mimic the users of a collaboration app.
- The load testing tool should be performant, meaning it should require minimal resources to generate the desired amount of load, enabling an efficient use of distributed hosts.
In terms of performance, because Edamame needs to support more than 100k virtual users, we required a load testing tool that had efficient use of both CPU and RAM.
- CPU efficiency corresponds to Requests Per Second (RPS). A high RPS means less CPU is utilized per request, so requests can be sent at a faster rate.
- RAM usage is determined by how much memory is required per virtual user. The less memory consumed per VU, the greater the number of VUs that can be supported by a single host.
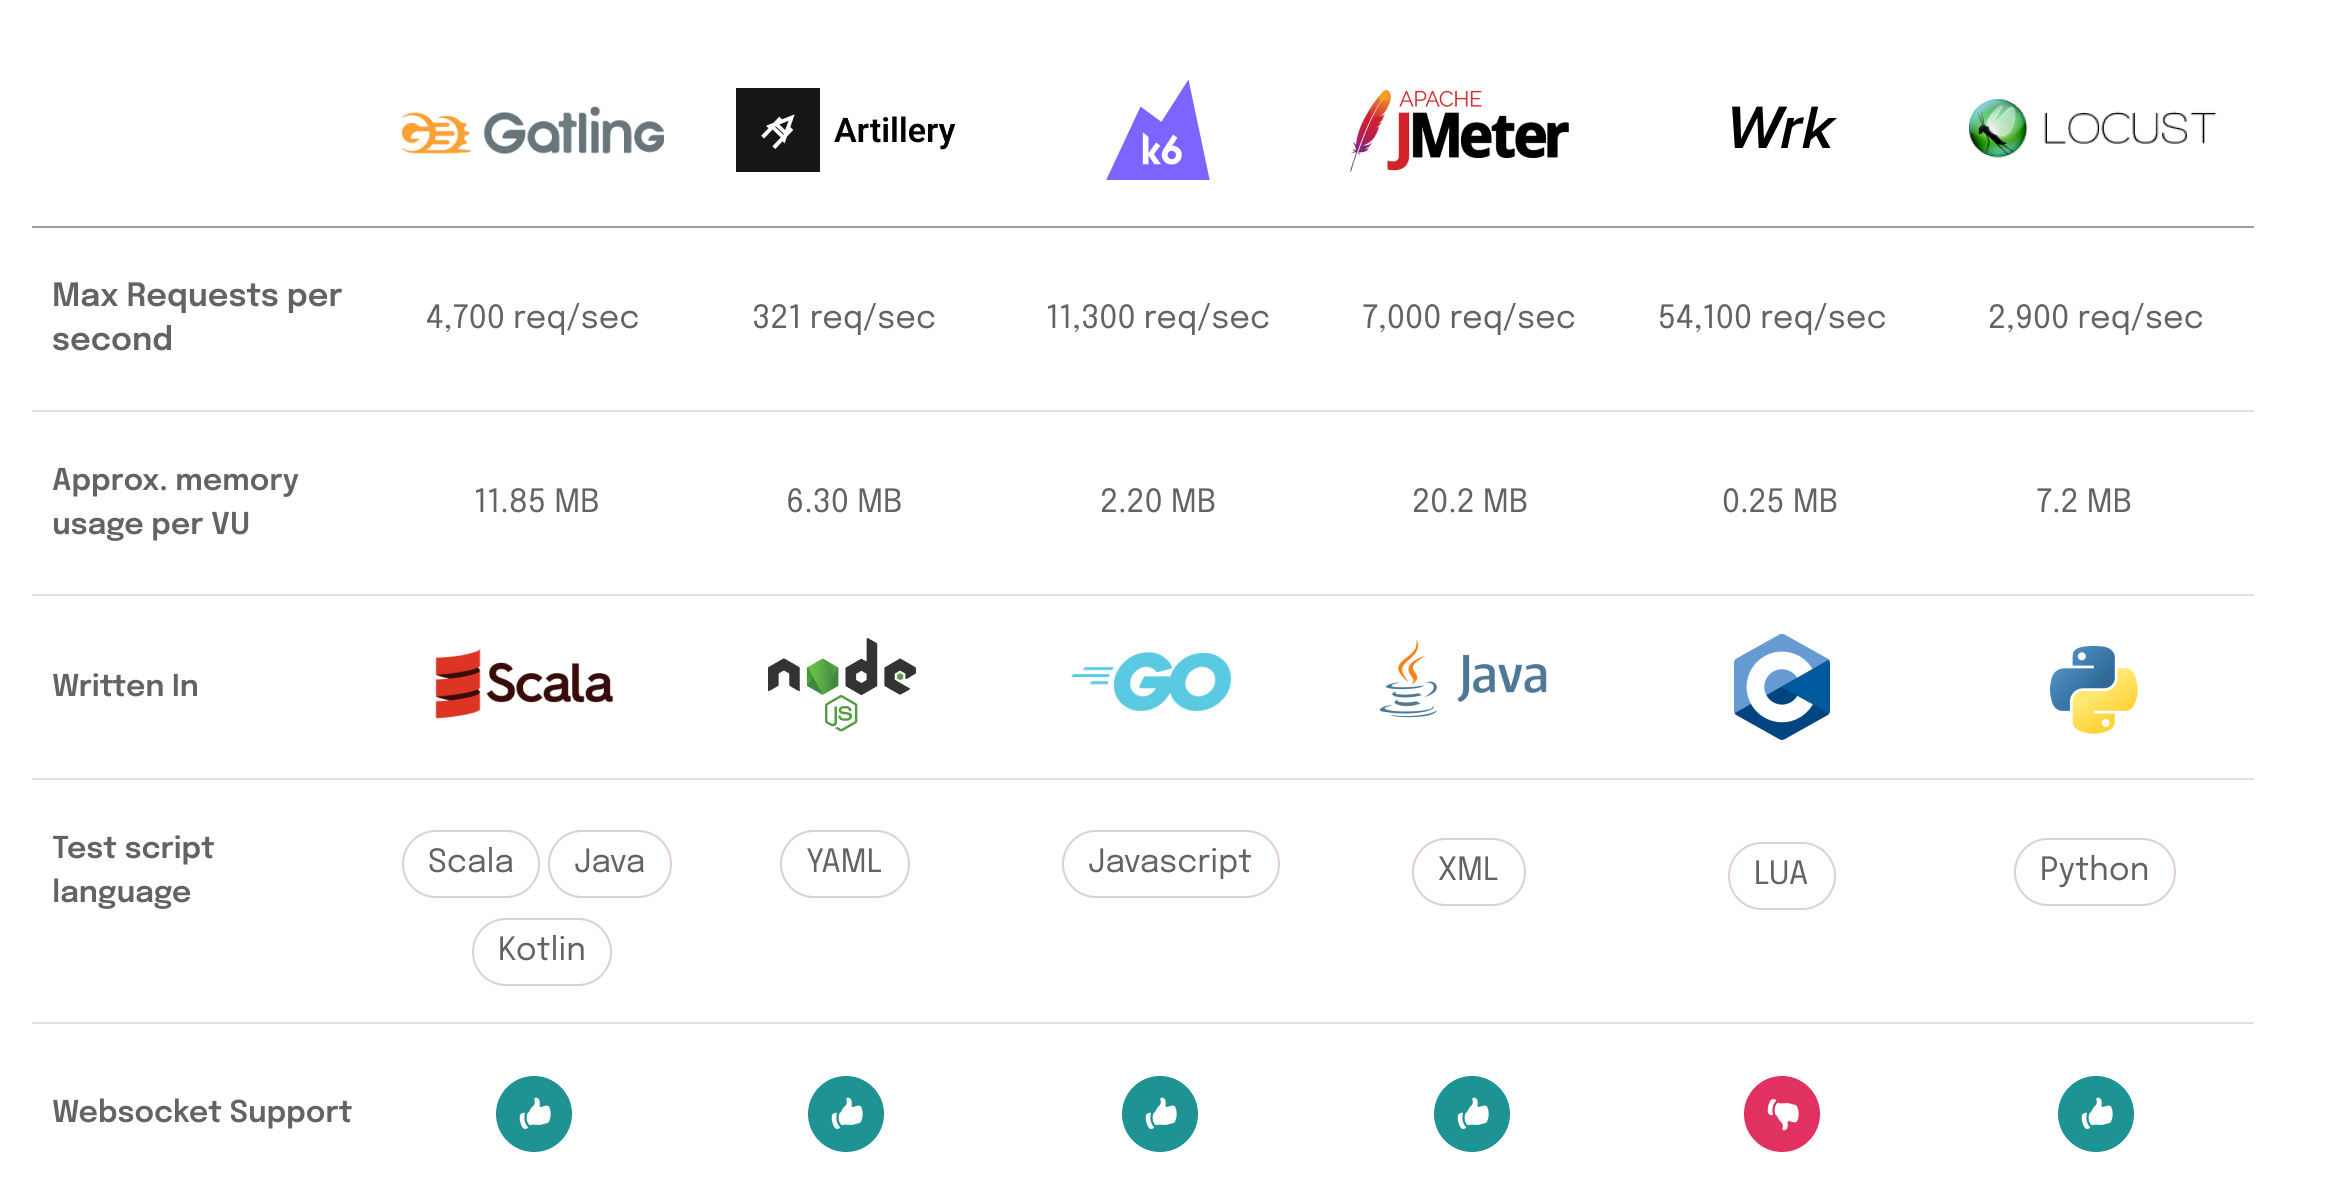
Ultimately, we chose k6 because it efficiently uses compute resources relative to other load testing tools. It is very lightweight in terms of RAM usage per VU and has a high RPS. Furthermore, it enables developers to write virtual user behaviors using JavaScript, a well-known language, and supports both HTTP and WebSockets. Finally, k6 is highly extensible, which means we were able to customize it in a number of ways. This gave us a lot of flexibility when it came to deciding the rest of the components in our architecture.
Synchronizing load generators
Containers gave us a way to efficiently deploy multiple instances of k6 to cloud servers for running distributed load tests. This meant we could deploy as many instances of k6 as necessary to reach the desired number of virtual users. However, these containers were isolated and unaware of each other. As previously mentioned, distributed load generators must be synchronized to ensure accurate results.
Containers are meant to be stateless. This is an issue, since synchronizing load generators requires managing the container state. This is because the status of all load generator containers must be known before the test can begin execution.
One approach to solve the problem of test synchronization is to use a leader-follower model for load generators. This means that a single container (the “leader”) would be responsible for determining test parameters and sharing those parameters with a number of “follower” containers. Follower containers would not begin test execution until they receive a command from the leader.19
However, configuring the leader-follower model for k6 load generators would require a number of custom components. First, the leader would need to be aware of all the IPs of the followers to communicate with them. This would also require some mechanism for monitoring readiness of each load generator. Finally, it would necessitate additional functionality for the leader to send a simultaneous start signal to all followers. The complexity involved with developing all these custom components led us to look for a simpler option.
K6 provides a means to synchronize tests in the form of the k6 operator, which can be deployed with Kubernetes. Kubernetes is a container orchestration tool that provides a layer of abstraction over containers and allows communication between different containers across various hosts and environments.20
To achieve this, Kubernetes gives us a number of components, such as Operators. Operators are meant to mimic the behavior of a human operator that manages a service.21 For example, it handles installing specific applications and ensuring that those applications are healthy within different containers. Therefore, they help us solve this problem of container state management.
To leverage the k6 operator for synchronizing load tests, Edamame deploys its infrastructure on AWS’s Elastic Kubernetes Service (EKS). This means that containerized applications (like k6) will be deployed on hosts in an EKS cluster.
When a user runs a load test with Edamame, they provide a test script which defines a quantity of virtual users and their behavior. This test script is applied to the EKS cluster as a configuration value that Kubernetes makes available to any containers running within the cluster. The k6 operator accesses the test script and manages the execution of the test.
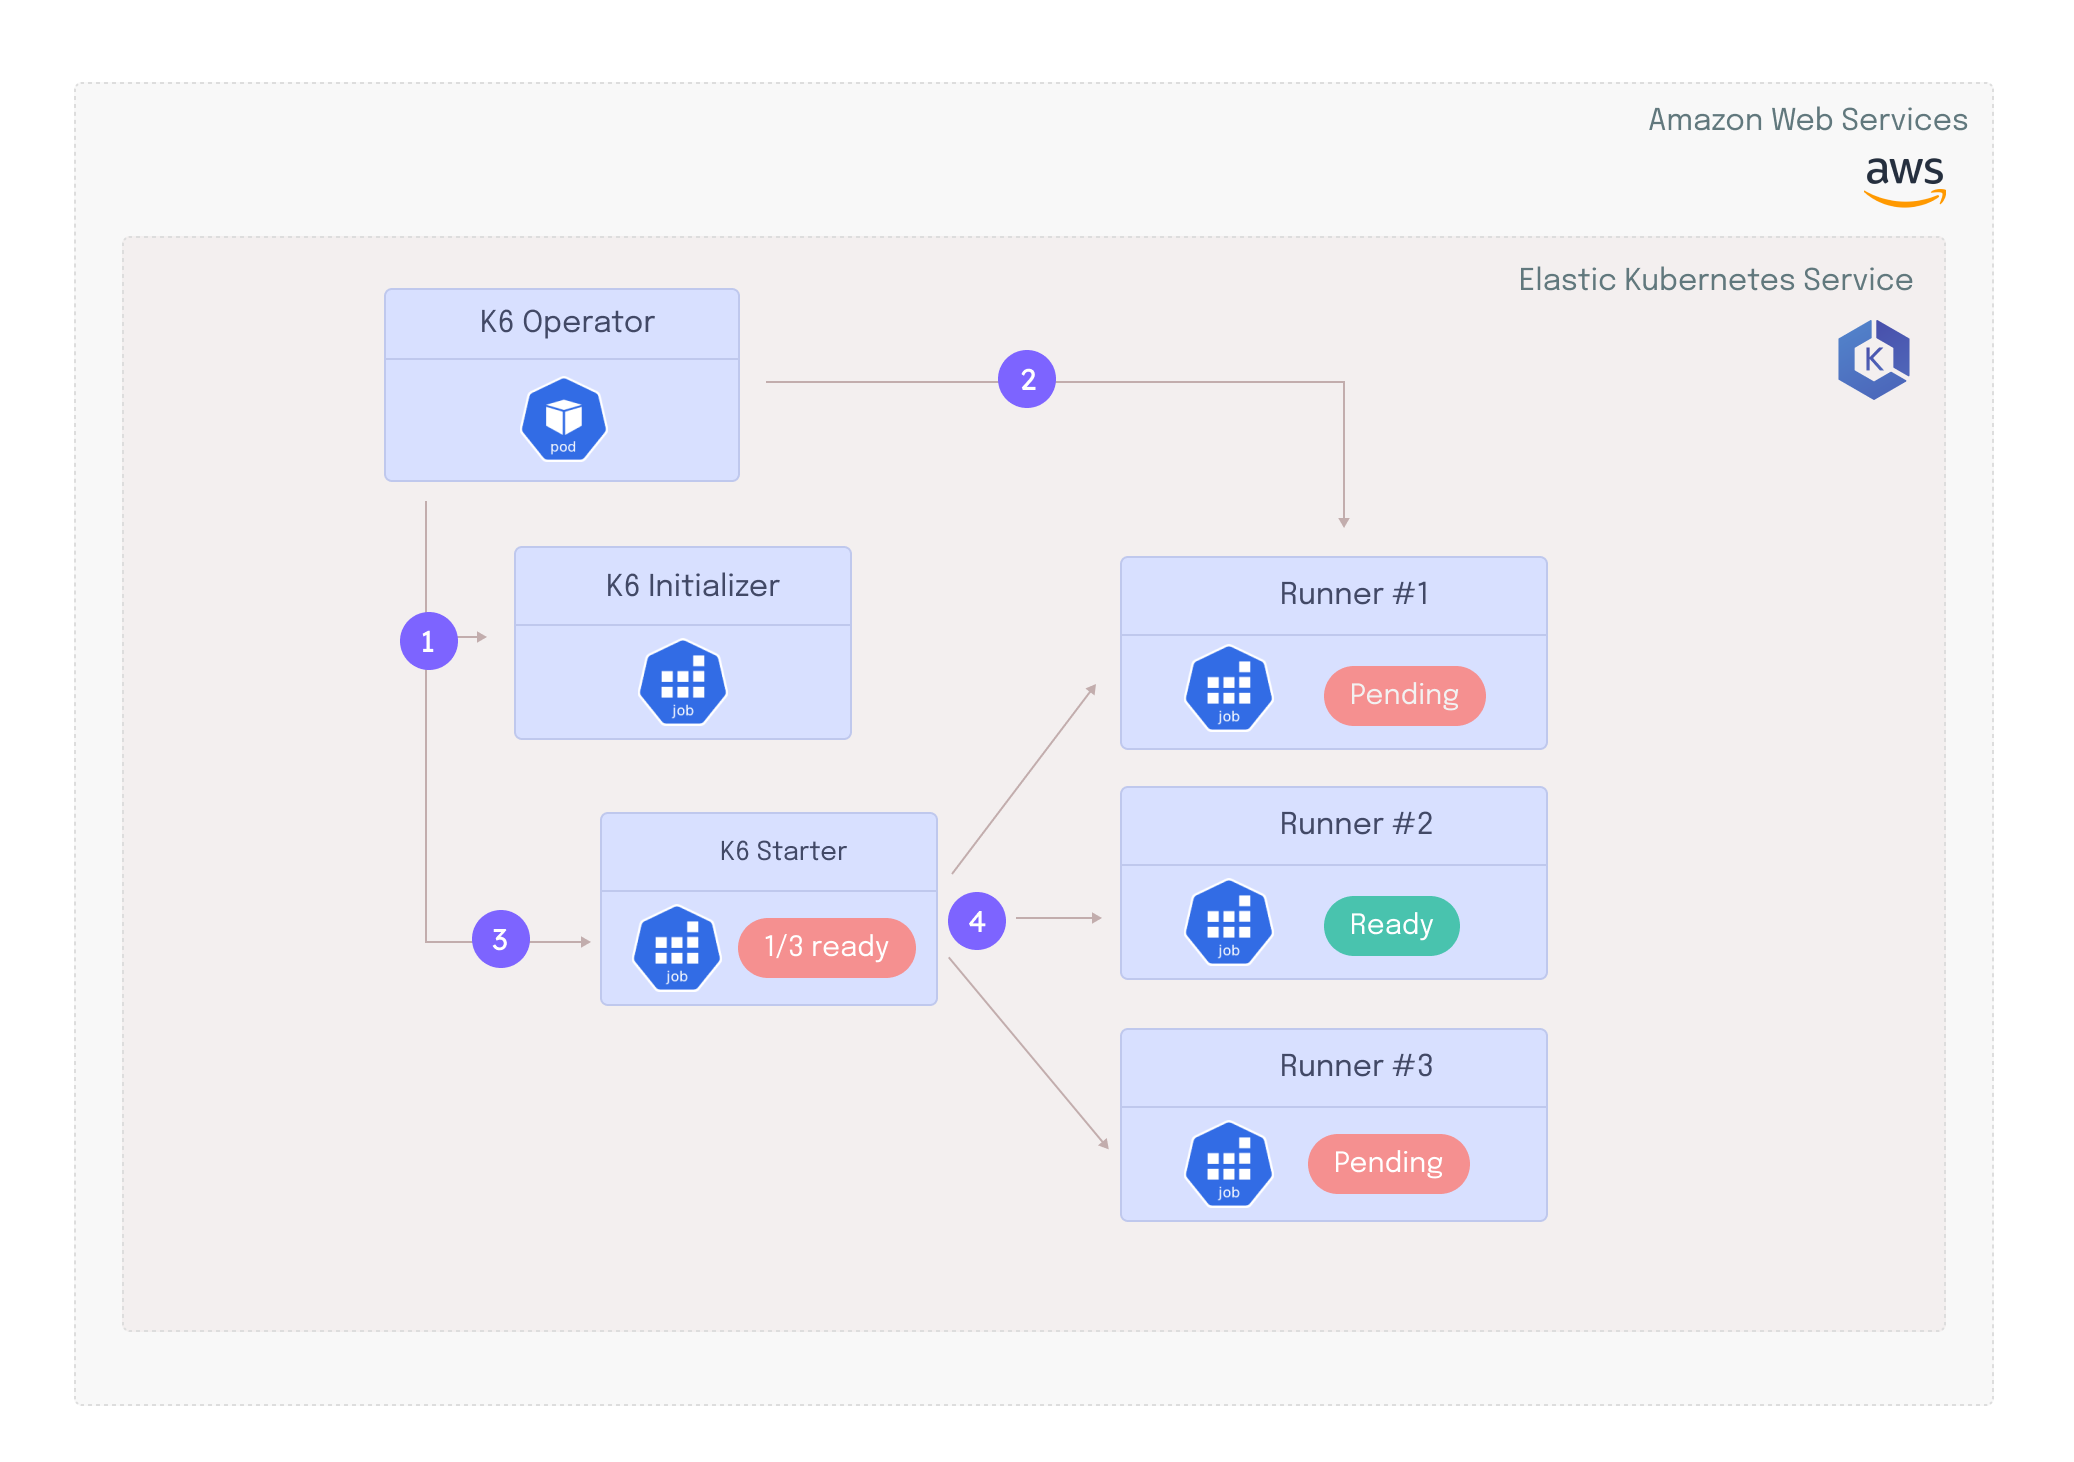
- First, the operator creates a new component called the initializer. This is a program that performs error handling (e.g. it checks the validity of the test script).
- Next, the operator creates test runners. These encapsulate the k6 load testing application and are responsible for accessing the test script, generating the load, and running the test.
- Third, the operator creates a starter program that is responsible for starting the execution of the test simultaneously in all test runners.
- Finally, after creating these three components, the k6 operator continuously polls the test runners for readiness, and when they are all ready, sends a signal to the starter to start the test execution.22
The k6 operator allowed us to synchronize our k6 instances running on different hosts, but one problem remained - Edamame still needed to specify the number of k6 runners that would be required for each test. This value is determined by the optimal number of VUs per runner, so the challenge became finding a number that both maximized runner CPU and memory without overloading these resources.
Optimizing compute resources
The number of runners required for each test is specified by Edamame using a value known as parallelism. This determines how many virtual users are being generated by each runner.22 For example, if a test script specifies a peak of 200 virtual users and parallelism is set to two, this will create two runners, each of which is responsible for generating 100 virtual users. On the other hand, a test script that specifies 200k virtual users with parallelism set to two will create two runners responsible for generating 100k virtual users each.
When a test runner is “overloaded” with too many virtual users, a number of issues might occur:
- The runner might not have enough CPU or RAM to produce the correct number of virtual users. If this is the case, developers might see the number of VUs in the test plateau and never reach the peak load specified in the test script.
- There might not be enough available bandwidth to handle all the requests being sent. If that’s the case, the number of requests sent will not match what is specified in the test script.
One way to deal with overloading is to play it safe, by setting an artificially low number of virtual users for each runner. However, this results in provisioning more compute resources for test runners than is actually required, which is inefficient. Therefore, the best way to ensure Edamame does not overload the test runners is to find the optimal number of VUs per runner and calculate parallelism dynamically based on that number.
K6 benchmarks23 indicate that up to 60k virtual users can be supported by a single m5.24xlarge host that has kernel level configurations applied to increase maximum requests per second. That being said, how test scripts are written can radically affect how much memory a single virtual user requires. The official k6 recommendation24 is to run no more than 30-40k virtual users per host.
Edamame sets a default value of 20k virtual users per runner, but provides the option to change this value. This allows developers to set the number of virtual users per runner that best suits the specific needs of their test scripts.
Building Edamame: Data Handling
Next, we’ll talk about the “data handling” component of our architecture, which involves stream processing 1M+ data points per second.
Processing 1M data points per second
While k6 met most of our requirements for a load testing tool, it does have a significant trade-off: it generates a huge amount of data. By default, k6 will output all the raw data from the load test without any kind of aggregation. For example, a test that simulates 100k virtual users — where each VU sends a WebSocket ping every second or an HTTP request every six seconds — results in an output of about 1 million data points per second.
| VUs | data points/sec |
|---|---|
| 1K | ~10K |
| 10K | ~100K |
| 100K | ~ 1 M |
We explored three ways to process all this data in near real-time:
- Write the raw data to a database
- Aggregate on the load generators before outputting to reduce data
- Aggregate data centrally in a stream processing pipeline
The first approach was to write data directly to a performant database. Since load testing data is typically plotted along a time axis, a time series database would have been appropriate for this use case.
Initially, we tried writing data to InfluxDB, a time series database optimized for write-heavy applications. However, we found that InfluxDB was overwriting data points, which led to inaccurate results. If two data points contain the same metric name, tag set, and timestamp InfluxDB considers them to be the same. Therefore data points received later can overwrite previously stored values that have the same characteristics.
We also tried sending data directly to TimescaleDB and found it could only handle about 100k writes per second. To avoid highly complex components such as a sharded or distributed database,25 we decided to try a different approach and attempt to aggregate data before storing it in the database.
The second option was to aggregate on each load generator. This would involve writing a k6 extension to aggregate raw test data before outputting it from the runners. Ideally, this preprocessing would result in a more manageable amount of data. However, there is an issue with this approach stemming from the fact that each load generator represents only a subset of the data.
We cannot aggregate metrics that we want to summarize with percentiles, such as HTTP response time, at each load generator. Doing so would potentially compromise the accuracy of the percentiles.
If we take the response times from each runner, find the 99th percentile, and then average them across runners, we’re not guaranteed to get the correct value, especially if a specific runner is for some reason receiving much faster or slower response times.
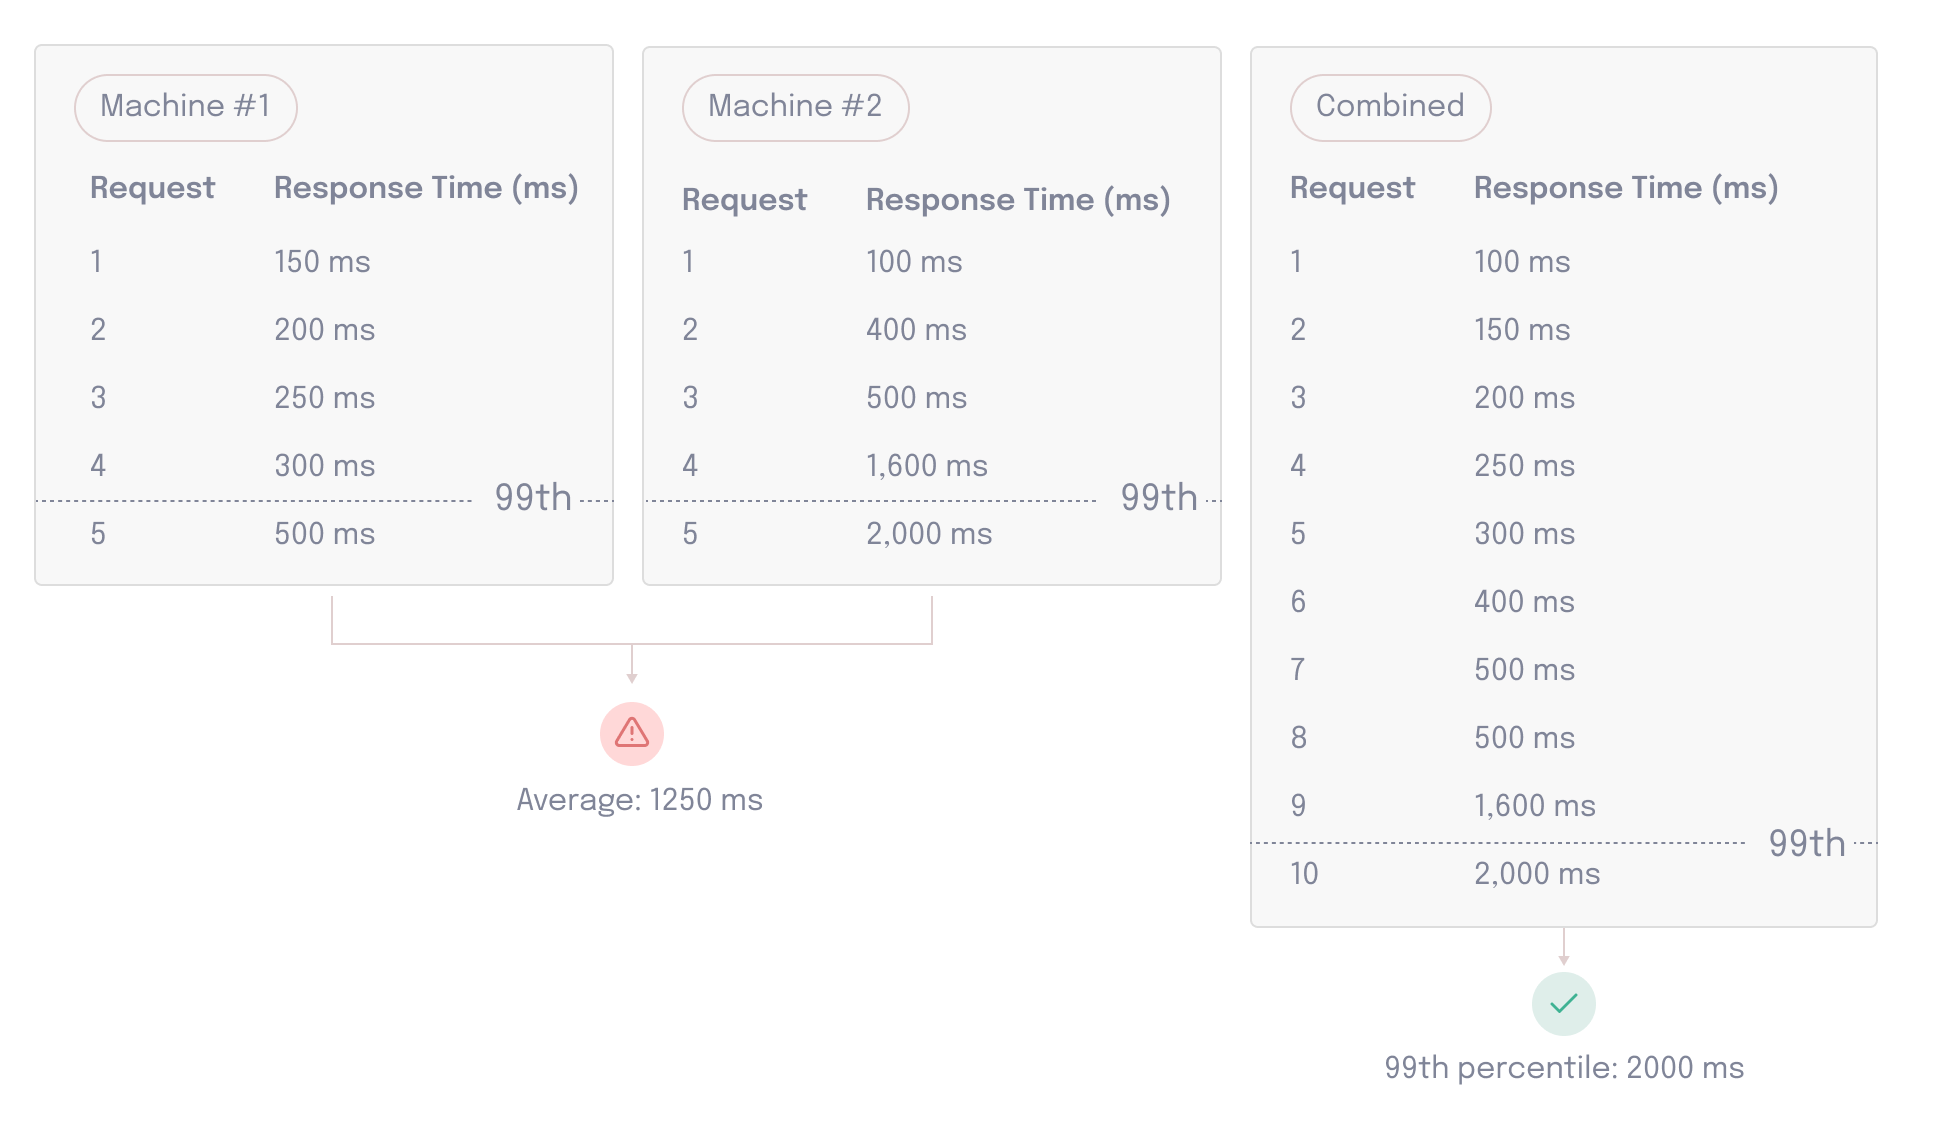
To ensure the aggregated percentile value is correct, it needs to be calculated with the entire data set. Based on these considerations, we ultimately decided to use a centralized stream processing server to aggregate load testing data in a single location. This would ingest data output by the test runners and output aggregated data points to the database on predetermined time windows known as “flush intervals”.
Stream processing pipeline
To implement this approach and process data centrally, we still needed to find a server that could handle the 1M data points per second output by the test runners.
StatsD is a server and protocol developed by Etsy for large-scale centralized data aggregation.26 The StatsD protocol is lightweight and text based. The StatsD server, however, has limitations. It was written in NodeJS, and lacked some of the efficiency we required. Namely, it only handles an ingestion rate of 10k data points/sec.27 There is, however, another implementation of the StatsD server called Statsite, written in C.
Statsite uses a single core with an event loop to handle much more data than the original StatsD server. It's also highly efficient when it comes to data aggregation. Trend based data points (e.g. HTTP response time) are aggregated into the specified percentiles using the count-min sketch,28 a probabilistic data structure that is much faster than sorting all of the raw data to arrive at the needed percentile. Probabilistic data structures like this allow us to "calculate a good approximation of percentiles at minimal CPU and memory cost" (Kleppman).29
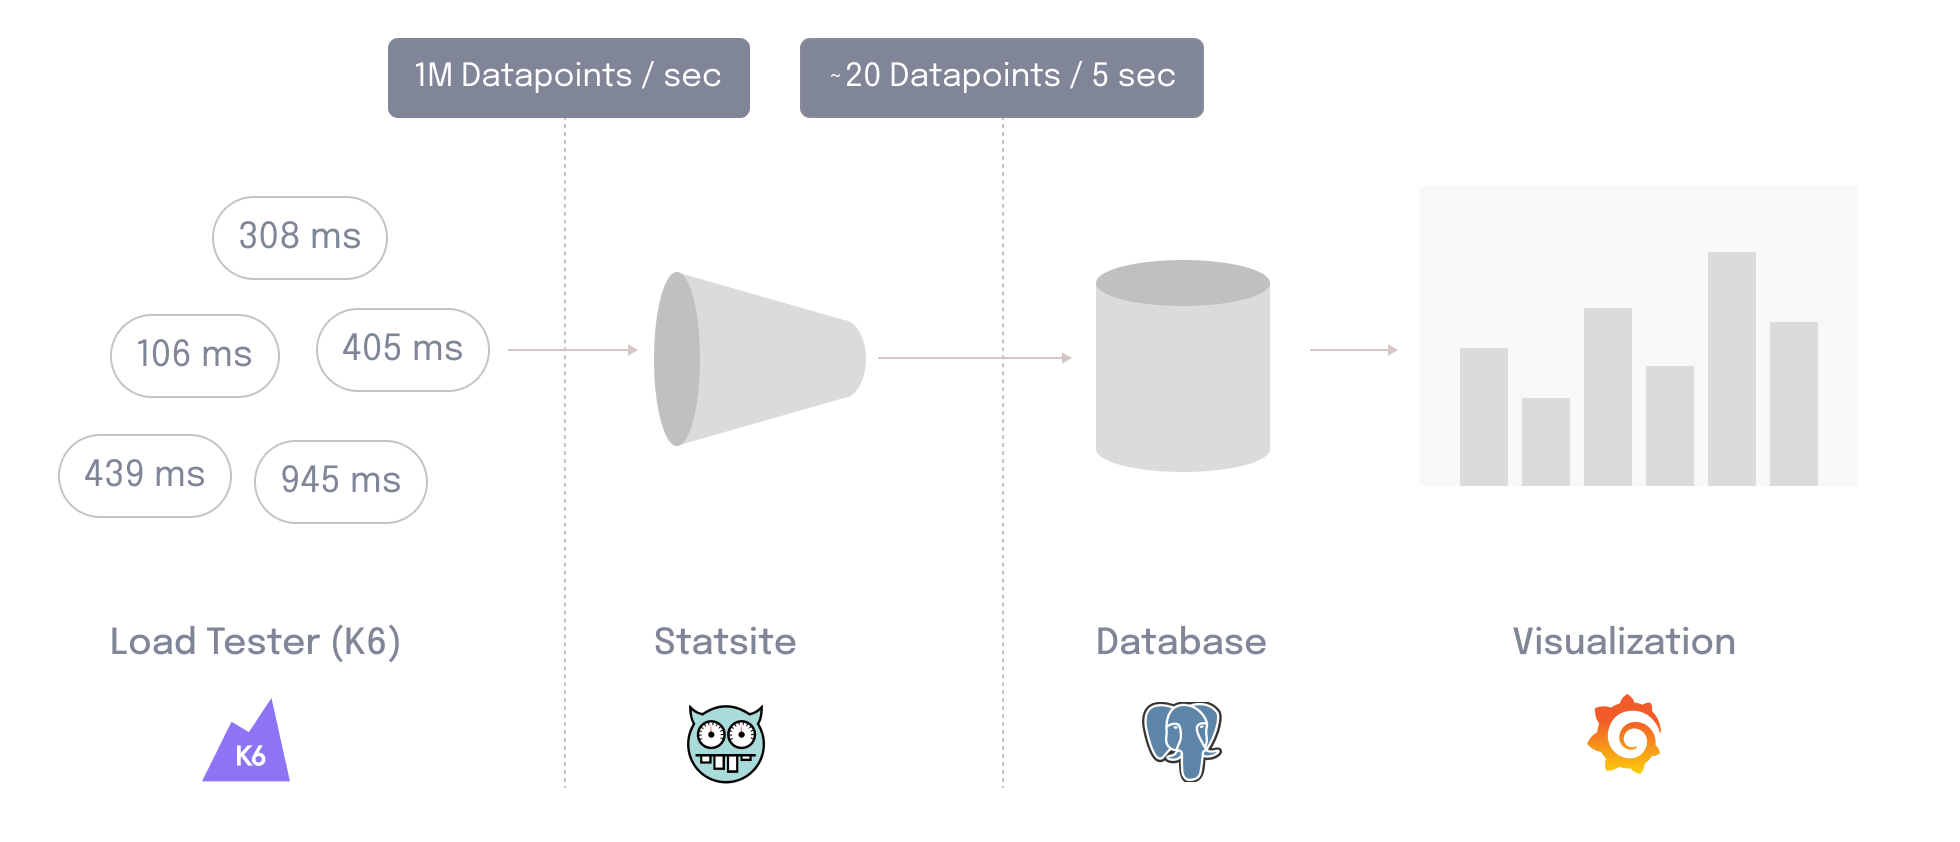
Overall, using Statsite allows Edamame to significantly minimize the number of database writes per second. For example, if the load test tracks 20 metrics, the result is 20 writes per five-second flush interval.
Since the data aggregation pipeline was able to minimize the number of writes per second so significantly, we no longer needed a specialized database for data storage. Therefore, Edamame utilizes PostgreSQL for data storage. This makes it easy for the user to set up any custom dashboards or queries necessary to visualize data, since PostgreSQL utilizes the well-known query language SQL.
Building Edamame: Data Visualization
Finally, we’ll talk about the “data visualization” component of our architecture, which involves visualizing important data for both HTTP and WebSockets.
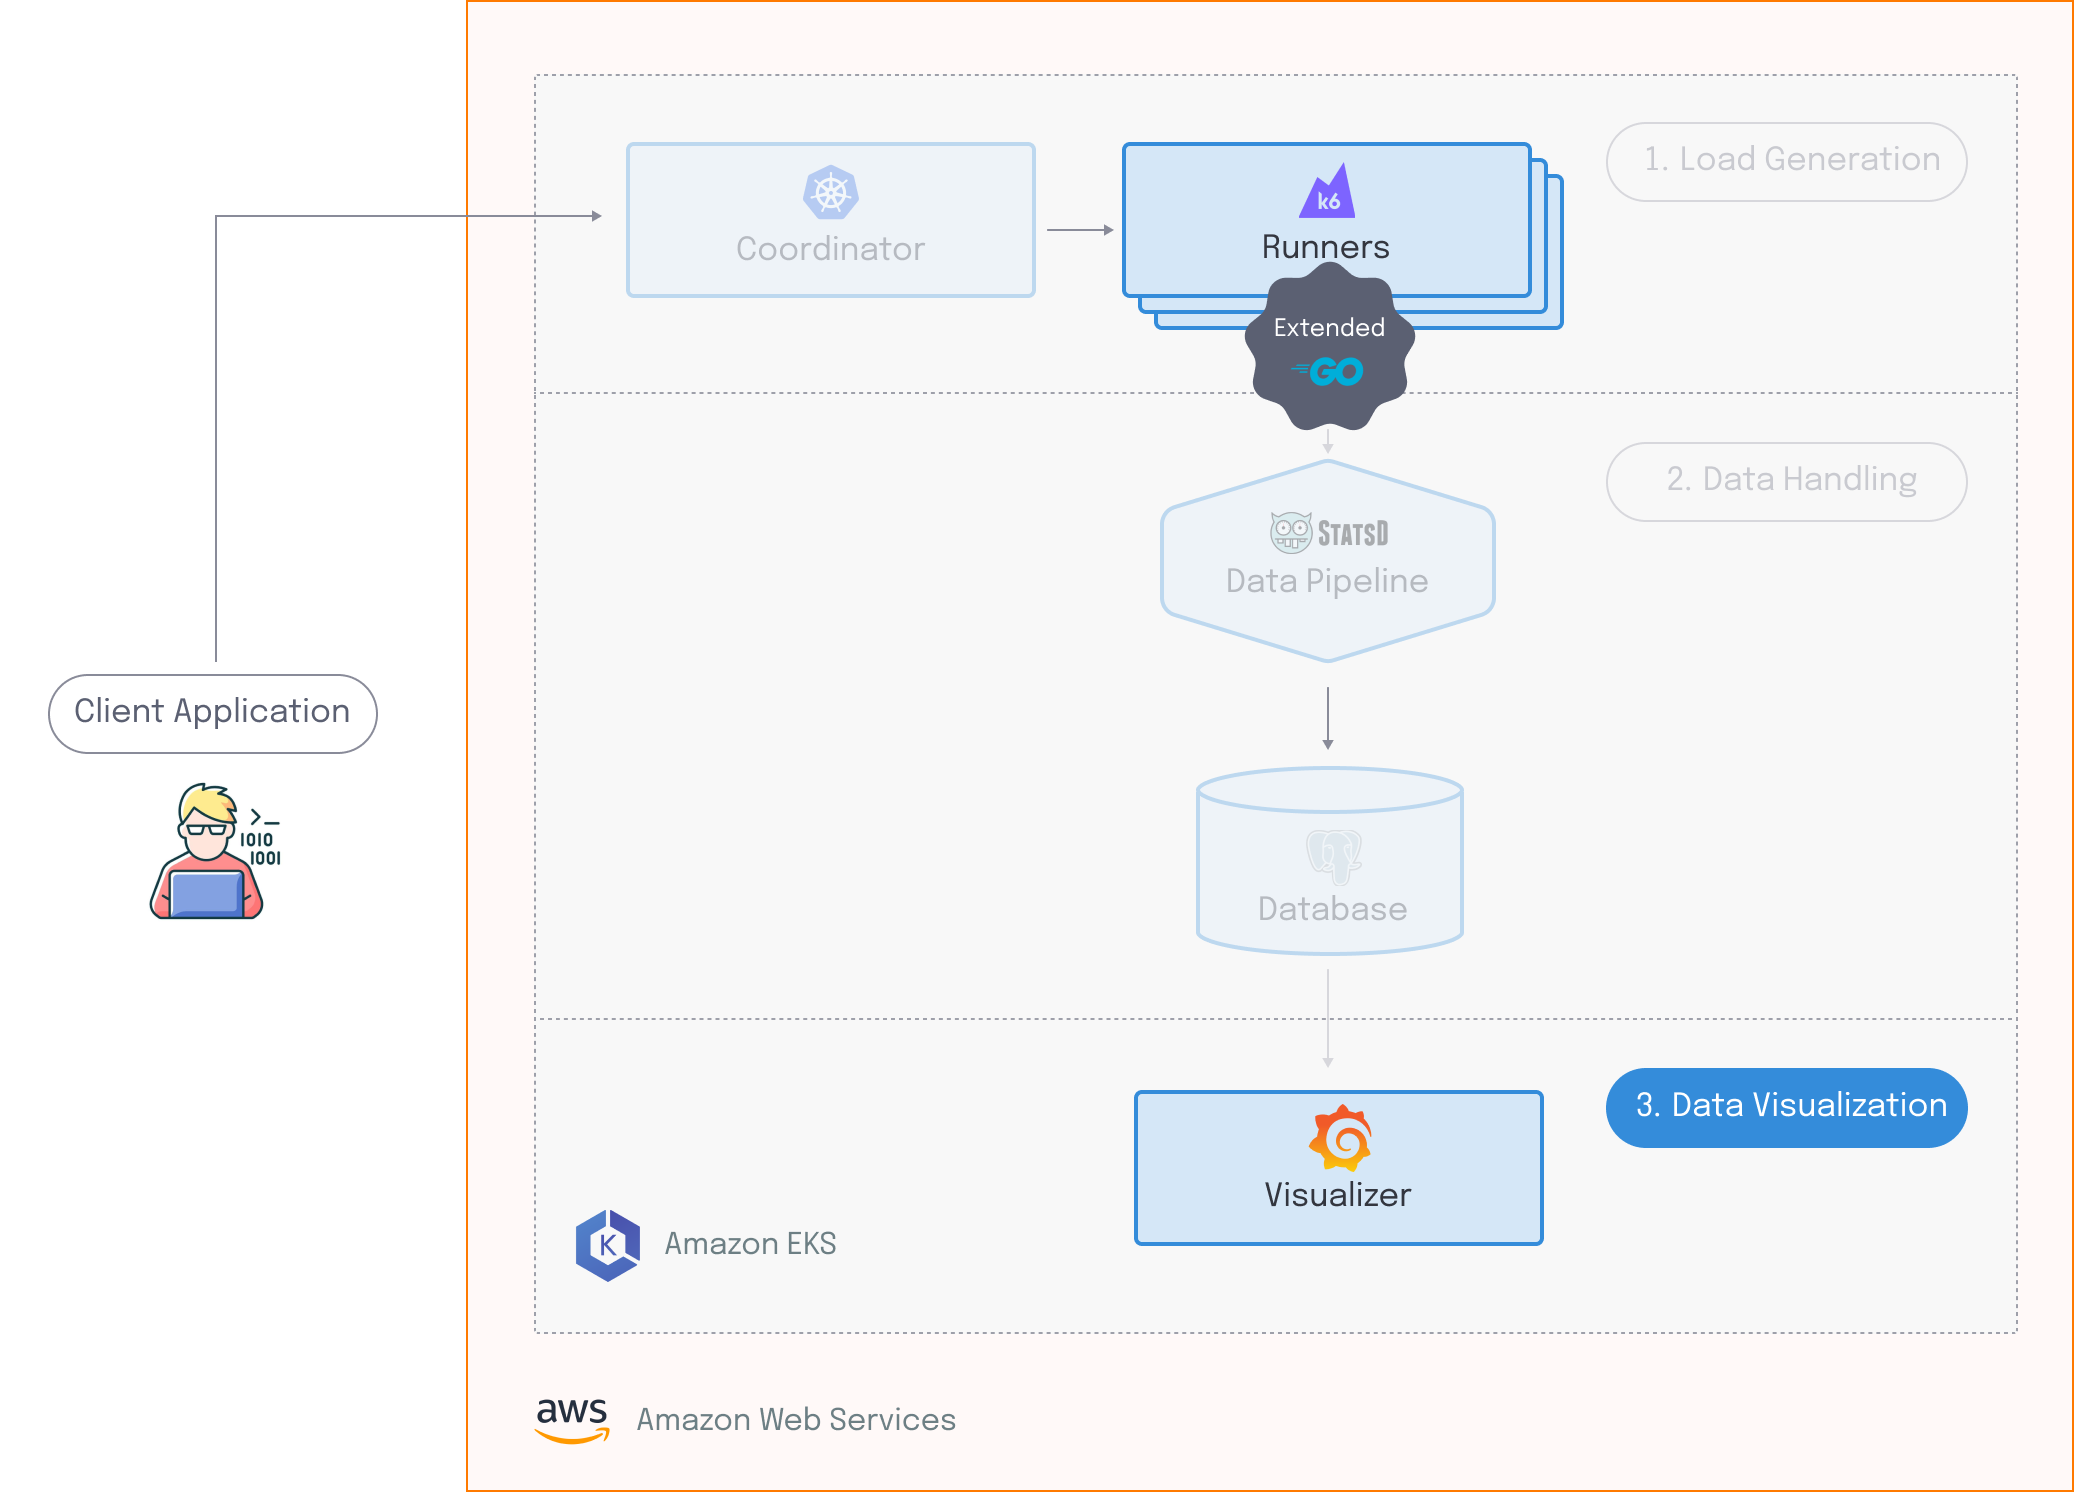
Extracting meaningful insights
While data was being successfully processed and stored, we still needed to give developers a way to make sense of that data. Grafana, a data visualization tool, provides a solution for this problem. Plotting metrics against the time they were collected allows users to pinpoint shifts in their system’s performance.
Edamame uses Grafana because it is open source, easy to use, and highly flexible. For example, users can configure custom dashboards with SQL that track and highlight the metrics most specific to their use case.

Figure 9.2: Edamame's custom Grafana HTTP dashboard
After setting up Grafana for data visualization, it became clear that k6 was missing a number of metrics that would have been useful in measuring the performance of a WebSocket server.
For example, default k6 metrics do not include the current number of WebSocket connections. If the number of virtual users in the test increases while the number of current WebSocket connections starts to plateau, this might indicate that the target system can no longer support additional connections. Another omission is the fact that k6 does not track WebSocket errors by default. An increase in errors could indicate performance issues that might not otherwise be visible.
K6 provides an interface that allows users to emit custom metrics. However, this requires developers to manually initialize and track each custom metric within their test script. This can become tedious and error prone. For example, to find the number of WebSocket errors, users must wrap code pertaining to custom metrics in a try…catch statement.
Furthermore, instead of looking at the number of WebSocket errors in general, developers might want to take a more granular look at what’s happening when errors occur. This can be achieved by tracking errors separately. For example, looking at the count of WebSocket abnormal closures can indicate when the server is dropping connections, but looking at the count of WebSocket failed handshakes can indicate when the server is having trouble making new connections. Tracking errors separately in a test script means nested conditionals within try…catch statements, which can make code hard to read and difficult to maintain.
import { Counter } from "k6/metrics";
import { setInterval } from "k6/x/timers";
// ... define duration + # of VUs here ...

const failedHandshakes = new Counter("failed_handshakes");
const abnormalClosures = new Counter("abnormal_closures");

export default function () {
  const url = "ws://127.0.0.1:8000/";
  let ws = new WebSocket(url);

  try {
    ws.addEventListener("open", () => {
      setInterval(() => {
        ws.ping();
      }, 10000);
    });
  } catch (e) {
    if (e.message.match("bad handshake")) {
      failedHandshakes.add(1);
    } else if (e.message.match("1006")) {
      abnormalClosures.add(1);
    }
    // ... can extend if statement to track additional errors...
  }
}
Instead of asking users to write these custom metrics into their test script, the k6 binary itself can be extended to emit additional metrics by default. On the one hand, this approach increases the complexity of the load generator deployment process by introducing more container dependencies. On the other hand, it has the benefit of automatically extracting meaningful insights into WebSocket performance
Building a custom k6 extension
We chose to write a custom extension that provides additional useful metrics out of the box. This ensures that users don’t have to worry about repeating verbose code in each of their test scripts to extract insights into WebSocket performance. Moreover, since Edamame is built for a specific use case, highlighting metrics pertinent to that use case make it a more powerful tool.
To produce better visibility into WebSocket performance, Edamame built a custom k6 extension in Go that tracks five additional metrics.
| Metric | Description |
|---|---|
ws_current_connections | The current number of active WebSocket connections. This is important because the k6 default metrics only provide the total number of connections, rather than how many connections are being persisted at any given time. |
ws_failed_handshakes | The number of WebSocket connections that could not be established. An increase in these failures could indicate performance issues with the target system. |
ws_abnormal_closure_error | The number of connections that are dropped, measured by counting the number of 1006 abnormal closure error messages. |
ws_msgs_bytes_sent | The total number of bytes sent in WebSocket messages. As the size of messages can vary widely, this provides additional context to the default k6 ws_msgs_sent metric. |
ws_msgs_bytes_received | The total number of bytes received in WebSocket messages. |
K6 provides two separate WebSocket modules that can be extended. The first, which is part of the k6 core offering, utilizes code syntax that is specific to k6. That is, it does not mirror the more well-known WebSocket API built into modern browsers. This means that in order to use it, developers must familiarize themselves with conventions unique to k6.
To allow users to write test scripts that more closely mirror the client-side code they may be used to, Edamame forked and extended the second WebSocket module that k6 offers. This is their experimental WebSockets library, which implements the WebSocket API living standard30. This makes writing test scripts more intuitive for users.
Edamame’s custom k6 extension is packaged into the k6 binary that runs on the load generators. The custom metrics are then emitted into the data pipeline, and written to the database. This enables Edamame to visualize how WebSocket and HTTP servers are performing under heavy load in tandem.
Edamame configures a default custom-dashboard for users that features these additional metrics. The dashboard is specifically designed to show WebSocket metrics in conjunction with HTTP. Since Grafana dashboards are defined using SQL queries, the user can easily customize the default dashboard or create dashboards of their own.

Figure 9.4: Edamame's custom Grafana dashboard for viewing HTTP and WebSocket metrics
Future plans
Edamame provides a robust framework for performing distributed load tests that target both HTTP and WebSockets. It supports tests of up to 200k virtual users, sufficiently tests complex systems with multiple protocols, and uses a performant data pipeline to aggregate and visualize data in near real-time. That being said, there are improvements and additional features that could be added in the future.
Improving scalability
Edamame's data pipeline relies on a single instance of a Statsite server to accurately aggregate test metrics into percentiles. Complications in aggregating percentiles limit the ability to scale this component horizontally. Currently, our stream processing relies on a probabilistic data structure that cannot be re-aggregated without losing data integrity. This means that data must be collected in a single location and we cannot currently scale beyond its maximum ingestion rate of 2 million data points per second, or approximately 200k virtual users. This is the main limiting factor when it comes to how many virtual users Edamame can support.
To simulate more than 200k virtual users without changing Edamame’s current architecture, changes would need to be made to the k6 StatsD output extension, which enables the load generators to output data using the StatsD protocol. Currently, it does not consolidate metrics like counters, which can be easily aggregated without data loss. Summing these data points into a single piece of data would decrease the amount of data being output per virtual user. This increases the amount of simulated load Edamame can generate before reaching Statsite's maximum ingestion rate.
# current
k6.ws_failed_handshakes:1|c
k6.ws_abnormal_closure_error:1|c
k6.ws_failed_handshakes:1|c
k6.ws_failed_handshakes:1|c

# consolidated
k6.ws_abnormal_closure_error:1|c
k6.ws_failed_handshakes:3|c
Alternatively, we can make the data pipeline more horizontally scalable. This would involve re-working the architecture, by switching to an approach where data is aggregated at each load generator. Special-purpose data structures like t-digest 31 enable percentiles to be aggregated in separate locations. The ability to accurately re-aggregate allows us to perform pre-processing on the load generators. This would immediately cut down on the amount of data being sent through the stream processor, allowing Edamame to scale to even higher numbers of virtual users.
That being said, aggregating data at each load generator involves sharing compute resources between test runners and data aggregation processes running on the same host. Moreover, there is no current support for t-digest in the k6 ecosystem, nor is there an available t-digest aggregation server, so this approach would involve developing several custom components from scratch.
Increased observability
Edamame specifies a default of 20k virtual users per load generator, but also provides the ability to set a custom number for this value. This leads to the following question: how does the user understand whether or not they are overloading load generator hosts? To provide users with better insight into load test performance, Edamame can increase observability. Currently, visibility into the health of load generators can be ascertained by installing a Kubernetes Dashboard.32
Rather than relying on additional third-party resources, in the future Edamame should provide metrics like CPU consumption, RAM consumption, and bandwidth for load generators. This would allow the user to tailor how load generating infrastructure is set up in a way that's more specific to the tests they are running.
Resources
- Nguyen, Britney. “Ticketmaster expected 1.5 million 'verified' Taylor Swift fans on the site but 14 million people were trying to get tickets, Live Nation chairman says: 'We could have filled 900 stadiums'.” Insider, 17 Nov. 2022, https://www.businessinsider.com/ticketmaster-14-million-people-tried-buy-taylor-swift-presale-tickets-2022-11↩
Wrkis an HTTP benchmarking tool written in C known for efficiency. See repo at: https://github.com/wg/wrk↩- k6 benchmarking results for EC2 instance type
m5.largehttps://github.com/grafana/k6-benchmarks/tree/master/results/v0.42.0#ec2-m5large↩ - Lönn, Ragnar. "Open source load testing tool review 2020." k6 Blog, 3 Mar. 2020, https://k6.io/blog/comparing-best-open-source-load-testing-tools/#memory-usage-per-vu-level↩
- AWS product details for M5 EC2 instance types https://aws.amazon.com/ec2/instance-types/m5/↩
- Ably. "What it takes to build a realtime chat or messaging app." Ably Blog, 23 Mar. 2023, https://ably.com/blog/what-it-takes-to-build-a-realtime-chat-or-messaging-app↩
- Google, Inc. "The WebSocket Protocol." Internet Engineering Task Force, Dec 2011, https://www.rfc-editor.org/rfc/rfc6455↩
- “Thundering herd problem.” Wikipedia, Wikimedia Foundation, 26 Nov. 2022, https://en.wikipedia.org/wiki/Thundering_herd_problem↩
- Necheukhin, Anton. "Reliable load testing with regards to unexpected nuances." Medium, 29 Apr. 2020, https://medium.com/miro-engineering/reliable-load-testing-with-regards-to-unexpected-nuances-6f38c82196a5↩
- Ramesh, Shreya. "Load Testing with Koi Pond." Slack Engineering Blog, Apr. 2022, https://slack.engineering/load-testing-with-koi-pond/↩
- k6. "Load testing websites" k6 Documentation, https://k6.io/docs/testing-guides/load-testing-websites/#execution-considerations↩
- “Batch Processing vs Real Time Data Streams.” Confluent, https://www.confluent.io/learn/batch-vs-real-time-data-processing/↩
- Apache Software Foundation. "Apache JMeter Distributed Testing Step-by-step." JMeter User Manual, https://jmeter.apache.org/usermanual/jmeter_distributed_testing_step_by_step.html↩
- Dingler, Lee, Lenz, Lopez, McGill, Nightingale. "Distributed Load Testing on AWS Implementation Guide." Amazon Web Services, Inc., Mar. 2023, https://docs.aws.amazon.com/pdfs/solutions/latest/distributed-load-testing-on-aws/distributed-load-testing-on-aws.pdf↩
- Google Cloud. "Distributed load testing using Google Kubernetes Engine." Cloud Architecture Center Documentation, 22 Apr. 2022, https://cloud.google.com/architecture/distributed-load-testing-using-gke↩
- Pricing sources for various cloud testing tools: k6 (https://k6.io/pricing/), Grafana Cloud (https://grafana.com/pricing/?pg=k6-cloud&plcmt=pricing-details), BlazeMeter (https://www.blazemeter.com/pricing), Artillery (https://www.artillery.io/pricing), Gatling (https://gatling.io/pricing/#cloud-monthly)↩
- Miric, Ivan. "Testing without limits: xk6 and k6 extensions." k6 Blog, 2 Dec. 2020, https://k6.io/blog/extending-k6-with-xk6/#how-xk6-works↩
- Artillery. "Distributed tests on AWS Lambda." Artillery Documentation, https://www.artillery.io/docs/guides/guides/distributed-load-tests-on-aws-lambda↩
- Locust. “Distributed load generation.” Locust Documentation, https://docs.locust.io/en/stable/running-distributed.html↩
- Kubernetes. “Overview.” Kubernetes Documentation, https://kubernetes.io/docs/concepts/overview/↩
- Deng, Głąb, Jones, Kahandi, Kantrowitz, Kinsella, Martin, Messer, Pellegrini, Schuetz, Seader, Strejevitch. "CNCF Operator [White Paper]." Cloud Native Computing Foundation, Jul. 2021, https://www.cncf.io/wp-content/uploads/2021/07/CNCF_Operator_WhitePaper.pdf↩
- Aronsson, Simon and Olha Yevtushenko. “Running distributed k6 tests on Kubernetes.” K6 Blog, 23 Jun. 2022, https://k6.io/blog/running-distributed-tests-on-k8s/↩
- k6 benchmarking results for EC2 instance type
m5.24xlargehttps://github.com/grafana/k6-benchmarks/tree/master/results/v0.42.0#rps-optimizedjs↩ - k6. "Running large tests." k6 Documentation, https://k6.io/docs/testing-guides/running-large-tests/↩
- Freedman, Mike and Erik Nordström. "Building a distributed time-series database on PostgreSQL." Timescale Blog, 21 Aug. 2019, https://www.timescale.com/blog/building-a-distributed-time-series-database-on-postgresql/↩
- Malpass, Ian. "Measure Anything, Measure Everything." Etsy: Code as Craft, 11 Feb. 2015, https://www.etsy.com/codeascraft/measure-anything-measure-everything↩
- "The main reason being that StatsD will max out at about 10K OPS (unless they've improved it recently) whereas Statsite will reach 10 MM. Also, look at the difference between the implementation of sets. StatsD uses a JS object versus statsite using a C implementation of HyperLogLog. If you're doing anything significant, you should not be using the node.js version of StatsD." Aimonetti, Matt. "Practical Guide to StatsD/Graphite Monitoring." Y Hacker News, comment by geetarista, 28 Jun. 2013, https://news.ycombinator.com/item?id=5958381↩
- "Count-min sketch." Wikipedia, Wikimedia Foundation, 9 Nov. 2022, https://en.wikipedia.org/wiki/Count%E2%80%93min_sketch↩
- Kleppman, Martin. Designing Data-Intensive Applications: The Big Ideas Behind Reliable, Scalable, and Maintainable Systems. "O'Reilly Media, Inc.," 2017.↩
- “WebSockets: Living Standard.” WebSocket Specification, 25 Oct. 2022, https://websockets.spec.whatwg.org/↩
- Cailliau, Pieter and Lior Kogan. "t-digest: A New Probabilistic Data Structure in Redis Stack." Redis Blog, 14 Mar. 2023, https://redis.com/blog/t-digest-in-redis-stack/↩
- Kubernetes Dashboard is a general purpose, web-based UI for Kubernetes clusters. It allows users to manage applications running in the cluster and troubleshoot them, as well as manage the cluster itself. See repo at: https://github.com/kubernetes/dashboard↩